 Stay
Stay 
Trading Conditions
Products
Tools


The EUR/USD currency pair showed very low volatility on Monday. There was only one scheduled event throughout the day that could have sparked market interest, and Christine Lagarde's speech took place later in the evening. At that time, there were no significant market jumps.
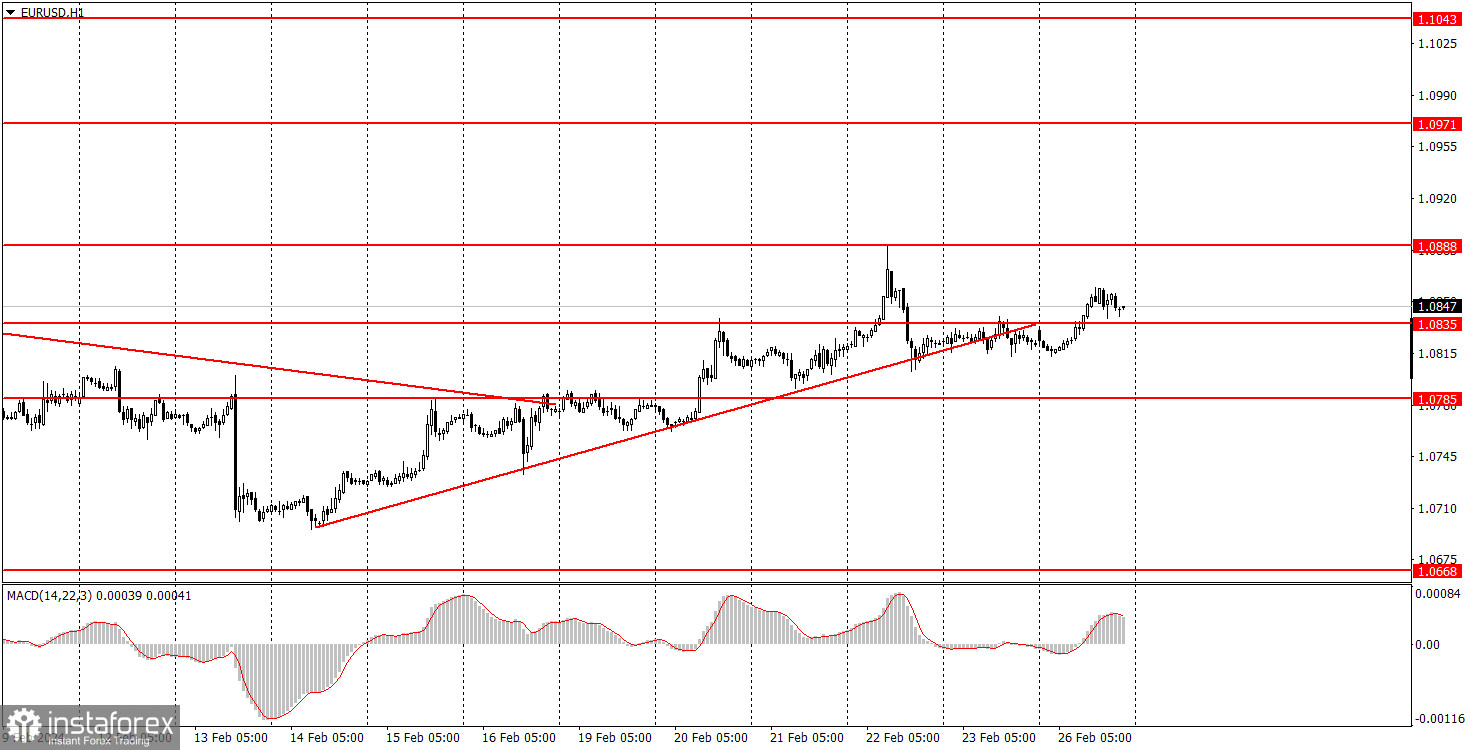
The European currency concludes the first day of the week with a slight increase, but on Friday, it managed to break the upward trendline. Thus, a decline in the euro may begin in the near future. The macroeconomic background for the week will be relatively weak, making it very difficult for the euro to find support. In the medium term, we still anticipate movements only to the downside.
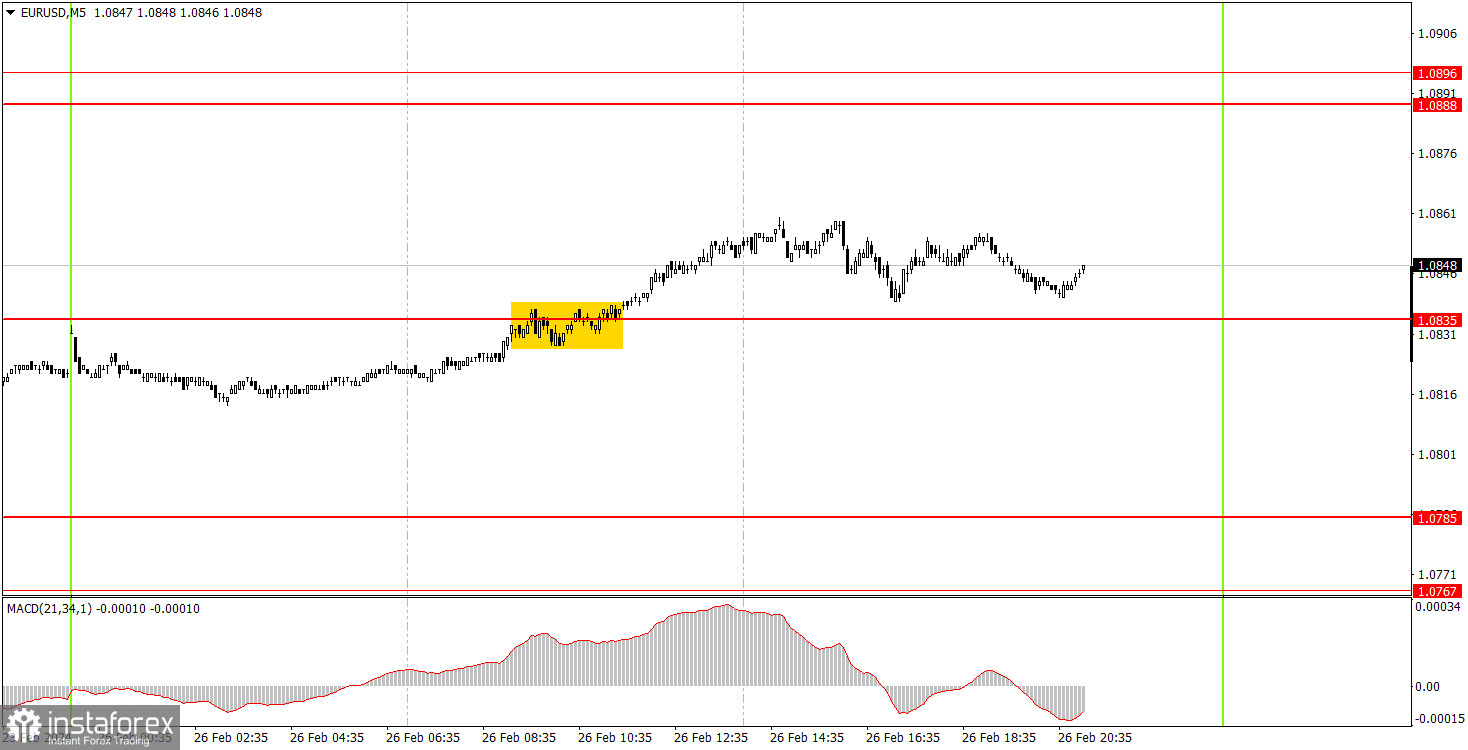
Only one trading signal was formed on the 5-minute timeframe on Monday. During the European trading session, the pair exceeded the level of 1.0835, so novice traders could open long positions. By the end of the day, the pair did not reach the nearest target level, but there were no sell signals formed. Therefore, traders could close their long positions at any convenient point, and they were profitable in any case.
On the hourly timeframe, the EUR/USD pair may continue to correct upward for some time, although there are still no macroeconomic and fundamental reasons for the rise of the euro. We still expect a resumption of the euro's decline, which, in our opinion, should continue for quite some time. We believe that a decline is more likely this week.
The key levels on the 5M chart are 1.0568, 1.0611-1.0618, 1.0668, 1.0725, 1.0767-1.0785, 1.0835, 1.0888-1.0896, 1.0940, 1.0971-1.0981, 1.1011, 1.1043, 1.1091.
There are no significant events in the European Union on Tuesday, but in the United States, an important report on durable goods orders will be released. We believe that the reaction to this report could be strong, especially if the deviation from the forecast is significant.
Support and Resistance price levels can serve as targets when buying or selling. You can place Take Profit levels near them.
Red lines represent channels or trend lines, depicting the current market trend and indicating the preferable trading direction.
The MACD(14,22,3) indicator, encompassing both the histogram and signal line, acts as an auxiliary tool and can also be used as a signal source.
Important speeches and reports (always noted in the news calendar) can significantly influence the price dynamics. Hence, trading during their release calls for heightened caution. It may be reasonable to exit the market to prevent abrupt price reversals against the prevailing trend.
Beginners should always remember that not every trade will yield profit. Establishing a clear strategy coupled with sound money management is the cornerstone of sustained trading success.
InstaForex analytical reviews will make you fully aware of market trends! Being an InstaForex client, you are provided with a large number of free services for efficient trading.


