 Stay
Stay 
Trading Conditions
Products
Tools


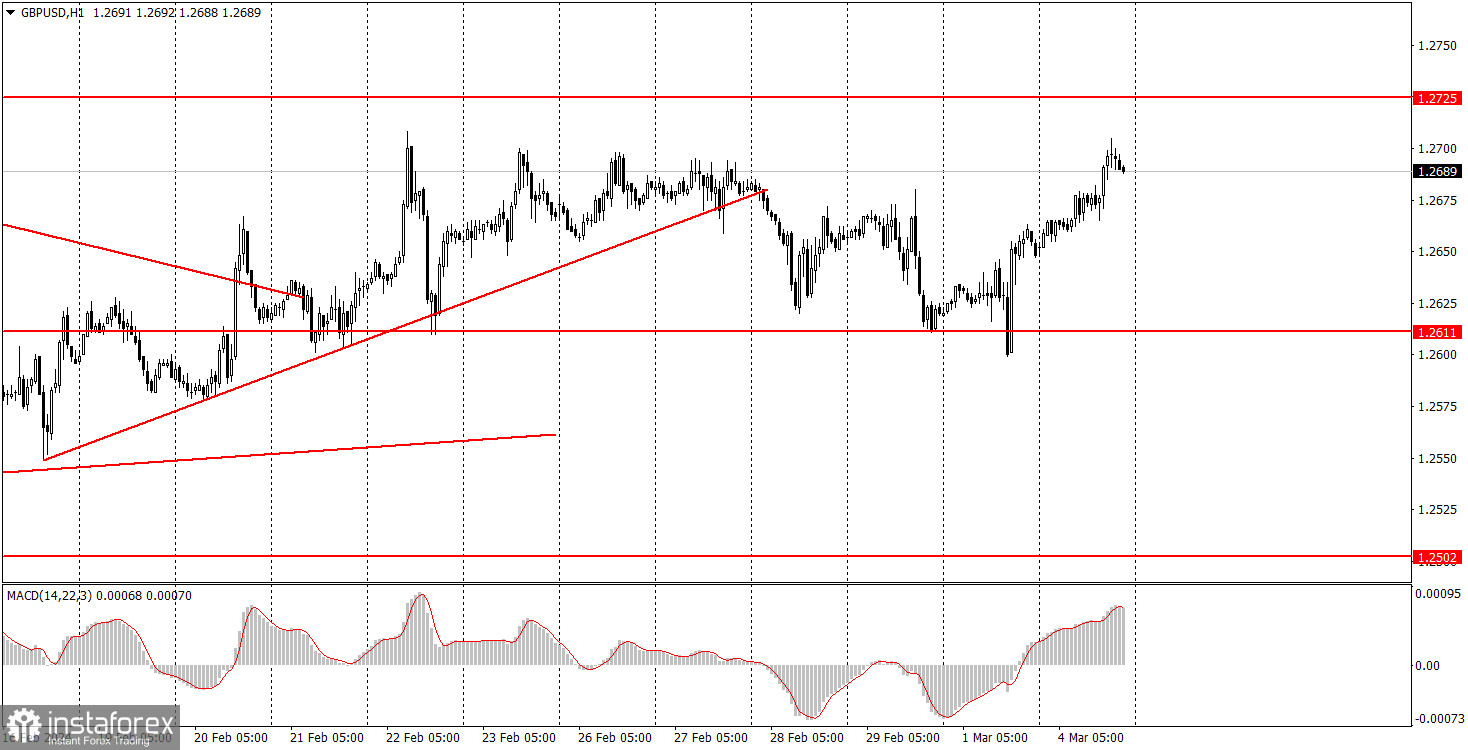
GBP/USD continued its upward movement on Monday after another bounce from the level of 1.2611. This level has long served as the lower boundary of a sideways channel, but even after the pair surpassed this mark, it still regularly provides support or resistance. Thus, the movement on Monday was purely technical. Volatility was not at its lowest, but it was still considered very low. What somewhat saved the situation was the fact that the price nearly moved in one direction for the entire day. However, we have to understand that we are still observing a flat. Moreover, we have a flat on the hourly time frame and on the 24-hour one. The British pound is simultaneously in several sideways channels. And clearly, such a situation does not form strong signals and good movements.
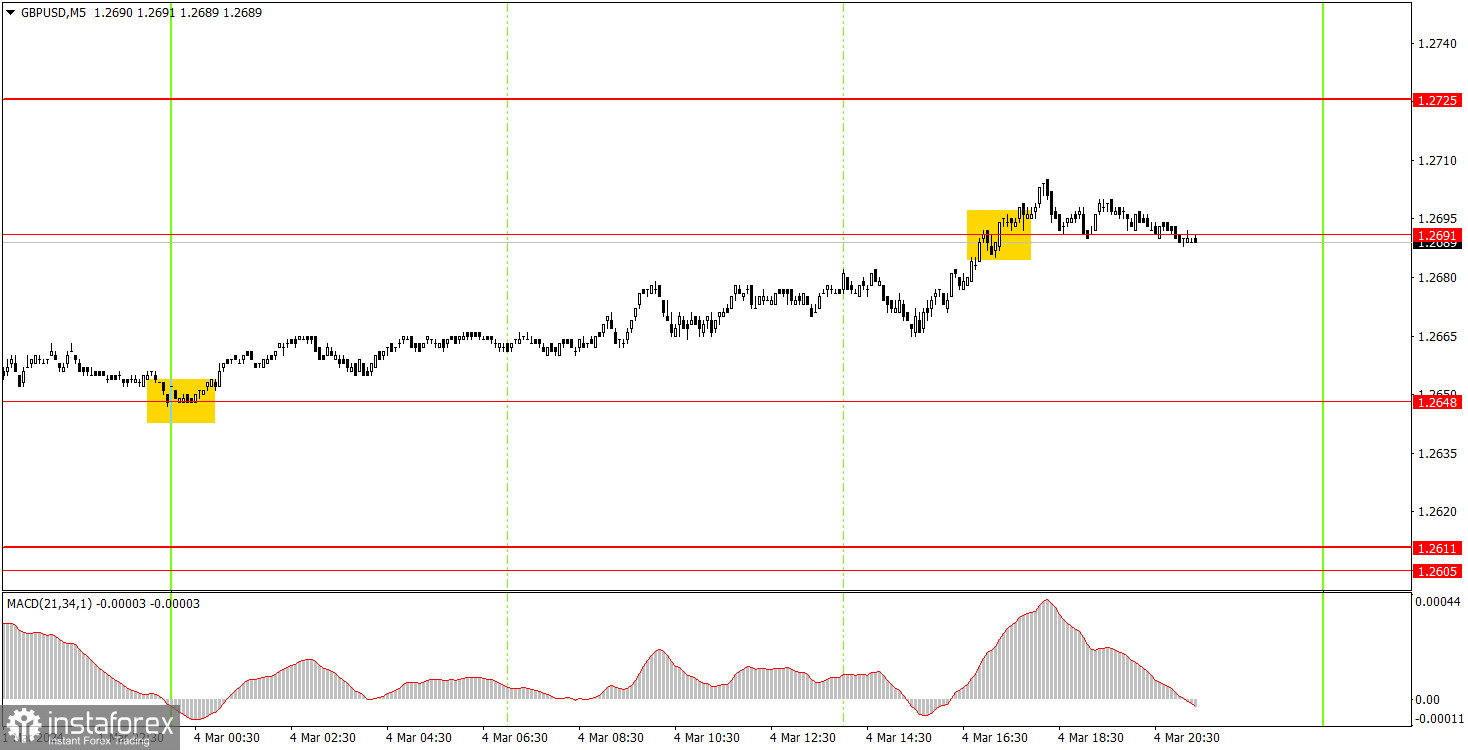
There were two trading signals on the 5-minute timeframe. A buy signal was formed around the level of 1.2648 overnight, and by the opening of the European trading session, the price had moved a short distance away from the formation point. Therefore, traders could open a long position based on this signal. During the US session, the pair worked through and exceeded the level of 1.2691, and the price remained above this mark almost until the end of the day. Therefore, beginners could close the position almost anywhere and at any time. The minimum profit for this trade was 35 pips.
On the hourly chart, GBP/USD left the sideways channel of 1.2611-1.2787 and is desperately trying to start a downtrend. However, it is not going well. We would say that the pound is already in another sideways channel. We expect the pound to fall, but the market is not in a rush to make trading decisions. We believe it is appropriate for you to consider short positions on the pound if the pair consolidates below the area of 1.2605-1.2611, but a downturn may occur at any time.
The key levels on the 5M chart are 1.2270, 1.2310, 1.2372-1.2387, 1.2457, 1.2502, 1.2544, 1.2605-1.2611, 1.2648, 1.2691, 1.2725, 1.2787-1.2791, 1.2848-1.2860, 1.2913, 1.2981-1.2993. On Tuesday, the UK will release the second estimate of the Services PMI for February. The US will release an important ISM Services PMI data. You should focus on this report.
1) Signal strength is determined by the time taken for its formation (either a bounce or level breach). A shorter formation time indicates a stronger signal.
2) If two or more trades around a certain level are initiated based on false signals, subsequent signals from that level should be disregarded.
3) In a flat market, any currency pair can produce multiple false signals or none at all. In any case, the flat trend is not the best condition for trading.
4) Trading activities are confined between the onset of the European session and mid-way through the U.S. session, after which all open trades should be manually closed.
5) On the 30-minute timeframe, trades based on MACD signals are only advisable amidst substantial volatility and an established trend, confirmed either by a trendline or trend channel.
6) If two levels lie closely together (ranging from 5 to 15 pips apart), they should be considered as a support or resistance zone.
Support and Resistance price levels can serve as targets when buying or selling. You can place Take Profit levels near them.
Red lines represent channels or trend lines, depicting the current market trend and indicating the preferable trading direction.
The MACD(14,22,3) indicator, encompassing both the histogram and signal line, acts as an auxiliary tool and can also be used as a signal source.
Significant speeches and reports (always noted in the news calendar) can profoundly influence the price dynamics. Hence, trading during their release calls for heightened caution. It may be reasonable to exit the market to prevent abrupt price reversals against the prevailing trend.
Beginners should always remember that not every trade will yield profit. Establishing a clear strategy coupled with sound money management is the cornerstone of sustained trading success.
InstaForex analytical reviews will make you fully aware of market trends! Being an InstaForex client, you are provided with a large number of free services for efficient trading.


