 Stay
Stay 
Trading Conditions
Products
Tools


EUR/USD experienced a minor downward correction on Monday but the uptrend persists in the short-term, as the pair remains above the trendline. Therefore, the euro could rise at any moment. We have repeatedly mentioned that the euro does not have any reason to rise. Some traders hope that all of the upward movement is just part of a correction, and once it ends, the pair could start a downward movement. However, the market continues to buy the euro, raising questions about the consistency of such movement.
On Monday, there were no important or interesting events. This explains the low volatility. The main item in today's agenda is the US inflation report, which can trigger any market reaction, as it is impossible to predict the value of the indicator in advance. Naturally, we expect the pair to consolidate below the trendline so it can fall further.
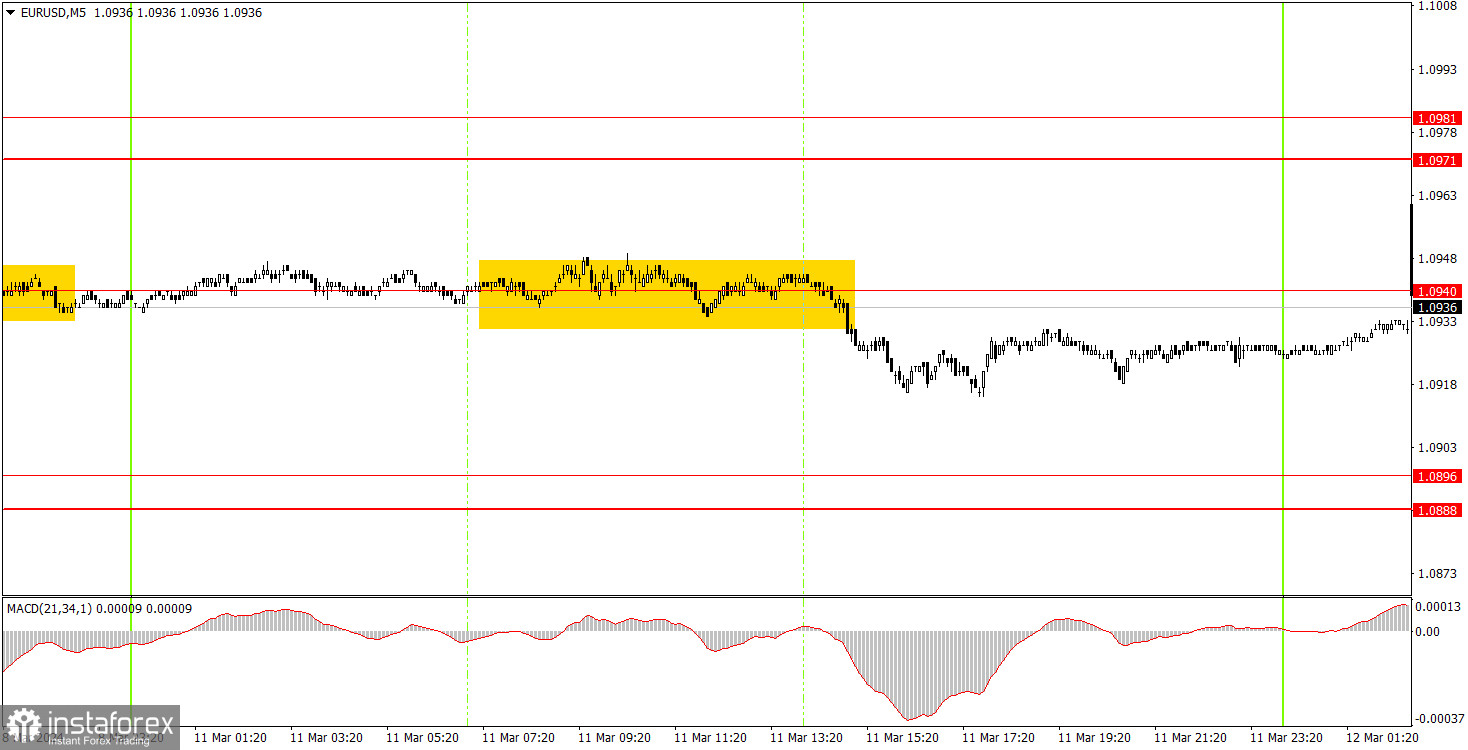
One sell signal was generated on the 5-minute timeframe. The price remained flat throughout the European session, and it only broke away from the level of 1.0940 during the US session. Traders could have used this to open short positions. However, it was a small profit, around 10-15 pips, as volatility was quite low.
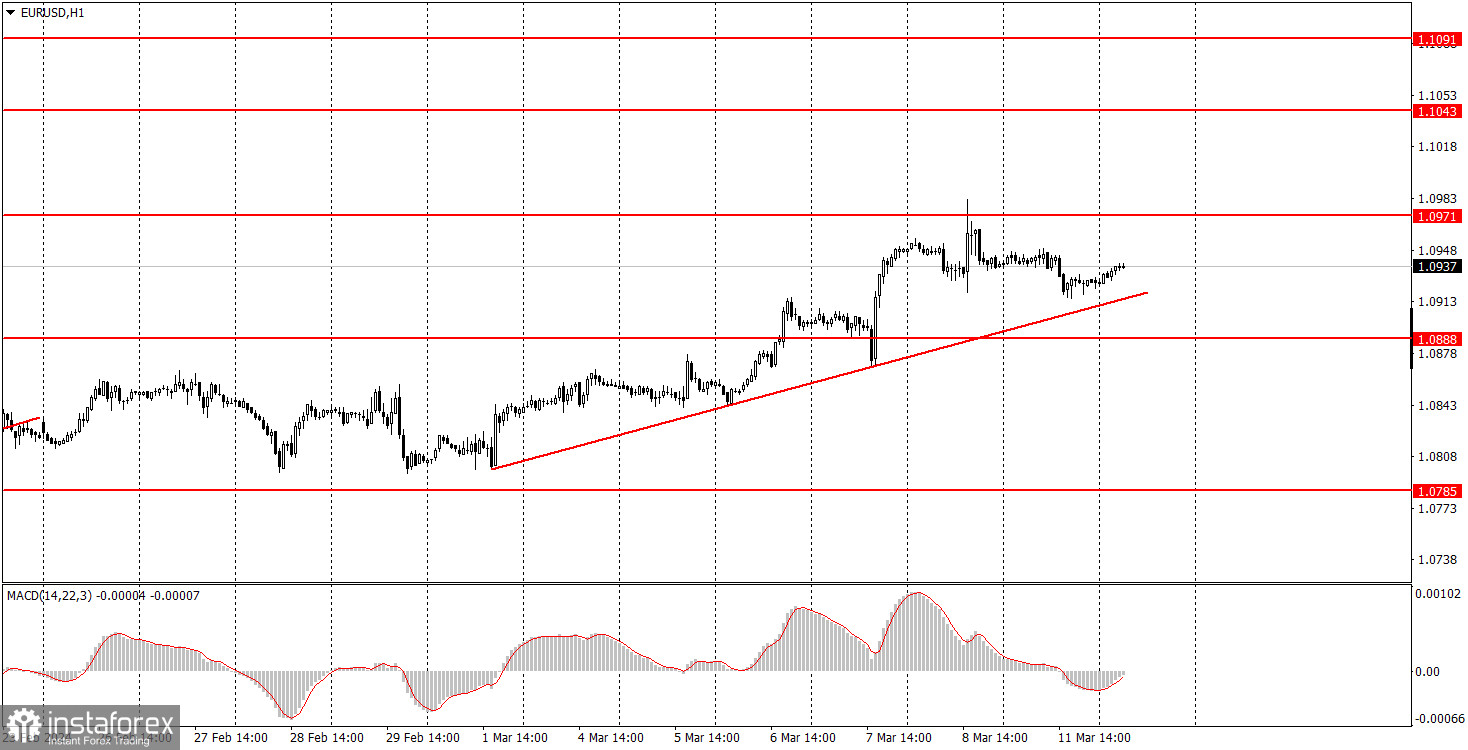
On the hourly chart, EUR/USD left the sideways channel and appears willing to resume the upward trend, although it has no fundamental reasons. We still expect the euro to resume its decline, which, in our opinion, should continue for quite some time, but the market is not in a rush. Unfortunately, at the moment, we are seeing illogical movements, which can still be attributed to the need for a bullish correction. But in this case, it should end in the near future. We believe that you should brace for short positions in case the price consolidates below the trendline.
The key levels on the 5M chart are 1.0568, 1.0611-1.0618, 1.0668, 1.0725, 1.0785-1.0797, 1.0855, 1.0888-1.0896, 1.0940, 1.0971-1.0981, 1.1011, 1.1043, 1.1091. On Tuesday, the final estimate of the Eurozone and German inflation data will be published, but these are secondary data. The US inflation report will warrant investor attention and the market may show a strong reaction.
1) Signal strength is determined by the time taken for its formation (either a bounce or level breach). A shorter formation time indicates a stronger signal.
2) If two or more trades around a certain level are initiated based on false signals, subsequent signals from that level should be disregarded.
3) In a flat market, any currency pair can produce multiple false signals or none at all. In any case, the flat trend is not the best condition for trading.
4) Trading activities are confined between the onset of the European session and mid-way through the U.S. session, after which all open trades should be manually closed.
5) On the 30-minute timeframe, trades based on MACD signals are only advisable amidst substantial volatility and an established trend, confirmed either by a trendline or trend channel.
6) If two levels lie closely together (ranging from 5 to 15 pips apart), they should be considered as a support or resistance zone.
Support and Resistance price levels can serve as targets when buying or selling. You can place Take Profit levels near them.
Red lines represent channels or trend lines, depicting the current market trend and indicating the preferable trading direction.
The MACD(14,22,3) indicator, encompassing both the histogram and signal line, acts as an auxiliary tool and can also be used as a signal source.
Significant speeches and reports (always noted in the news calendar) can profoundly influence the price dynamics. Hence, trading during their release calls for heightened caution. It may be reasonable to exit the market to prevent abrupt price reversals against the prevailing trend.
Beginning traders should always remember that not every trade will yield profit. Establishing a clear strategy coupled with sound money management is the cornerstone of sustained trading success.
InstaForex analytical reviews will make you fully aware of market trends! Being an InstaForex client, you are provided with a large number of free services for efficient trading.


