 Stay
Stay 
Trading Conditions
Products
Tools


GBP/USD also showed a decent downward movement on Thursday, but at the same time, it failed to consolidate below the Senkou Span B line. Therefore, despite breaking above the Kijun-sen line and the trend line, the uptrend persists and may start all over again. The US dollar had a reason to strengthen on Thursday. The Producer Price Index surprisingly exceeded forecasts, increasing the risks of accelerated inflation in the US. As a result, this postpones the timing of the Federal Reserve's first rate cut. Therefore, it was logical for the dollar to appreciate. It's just a pity that it didn't capitalize on numerous opportunities for similar growth earlier.
If the price breaches the Senkou Span B line, it will be a huge step towards the downtrend. Despite the fact that the market has been unreasonably maintaining high demand for the British pound for half a year now, this situation cannot last forever. Therefore, now is a good time to start a new downtrend. The main thing is to surpass the Senkou Span B line.
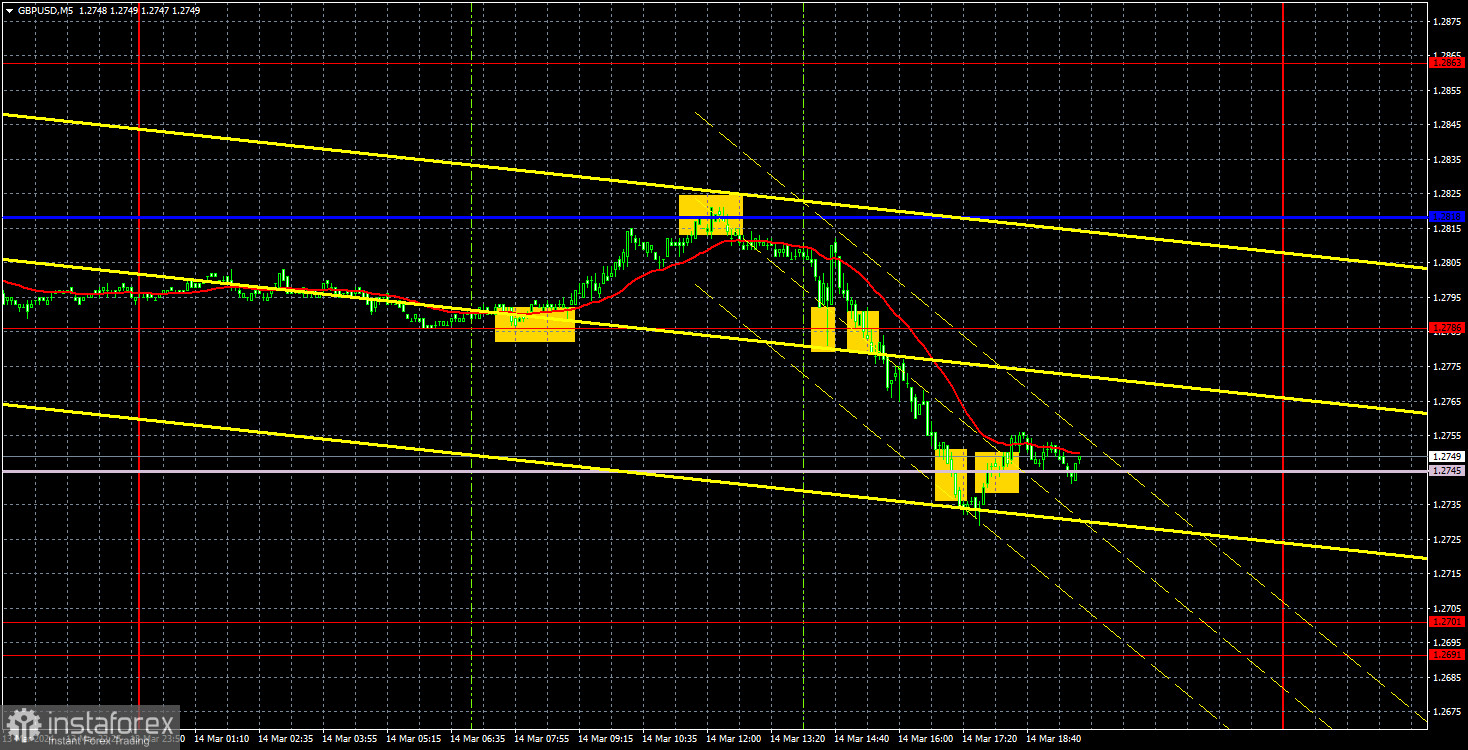
As for trading signals, there were quite a few of them on Thursday. Initially, the pair rebounded from the level of 1.2786 and reached the critical line. Then it bounced off the critical line and returned to 1.2786. It bounced off 1.2786 again (this was already a false signal but closed at breakeven using a Stop Loss). Then there was a breakthrough of the 1.2786 level and the pair fell to the Senkou Span B line, near which one could close short positions. In total, we got three profitable trades. The total profit was about 50 pips. Volatility on Thursday was comparatively higher than in the last couple of days, so good signals started to form immediately, resulting in good profits. Once again, we remind you that volatility is one of the key factors because if there is no movement in the market, there is nothing to trade.
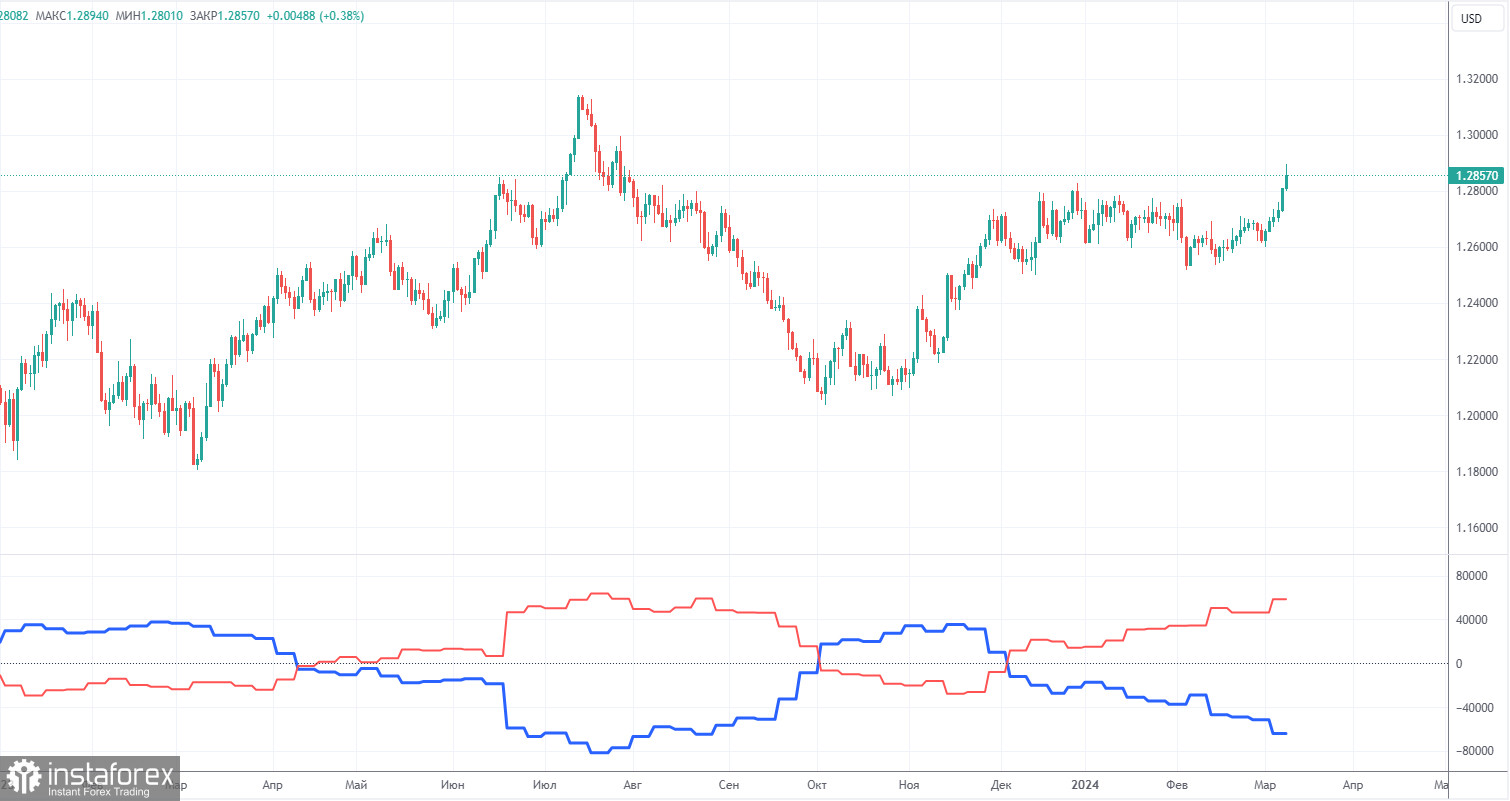
COT reports on the British pound show that the sentiment of commercial traders has frequently changed in recent months. The red and blue lines, which represent the net positions of commercial and non-commercial traders, constantly intersect and, in most cases, remain close to the zero mark. According to the latest report on the British pound, the non-commercial group opened 10,300 buy contracts and closed 1,700 short ones. As a result, the net position of non-commercial traders increased by 12,000 contracts in a week. Despite the fact that the net position of speculators is growing, the fundamental background still does not provide a basis for long-term purchases of the pound sterling.
The non-commercial group currently has a total of 102,000 buy contracts and 43,900 sell contracts. The bulls have a big advantage. However, in recent months, we have repeatedly encountered the same situation: the net position either increases or decreases, the bulls or the bears either have the advantage. Since the COT reports do not provide an accurate forecast of the market's behavior at the moment, we have to scrutinize the technical picture and economic reports. The technical analysis suggests that there's a possibility that the pound could show a pronounced downward movement, but there is currently no sell signal on any timeframe.
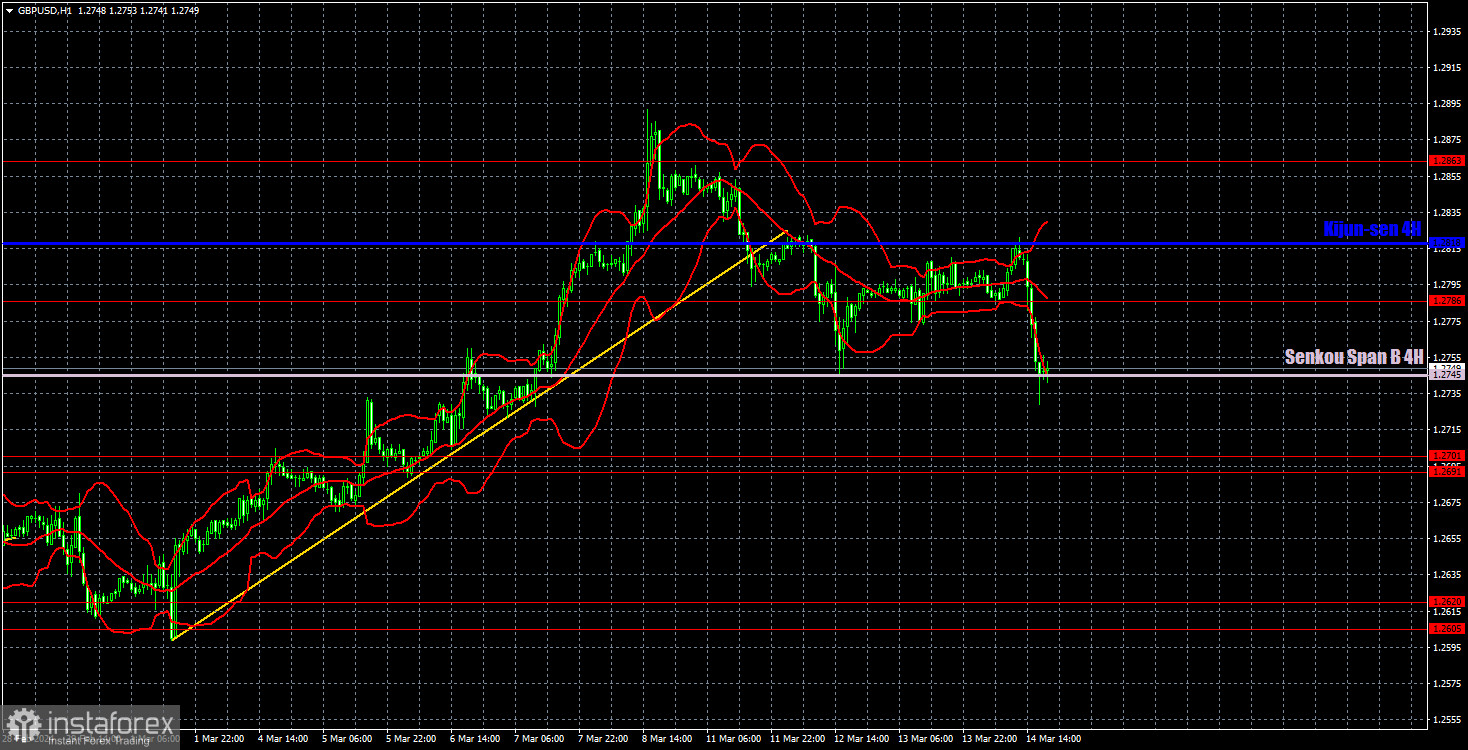
On the 1H chart, GBP/USD resumed the uptrend after a three-month flat. The economic reports and the fundamental background do not support the British pound, but we have already seen something similar in the second half of 2023. If the price consolidates below the trendline and the Kijun-sen line, we can hope that the dollar may start a small corrective phase, but this correction may end as soon as today if the price does not breach the Senkou Span B line.
As of March 15, we highlight the following important levels: 1.2215, 1.2269, 1.2349, 1.2429-1.2445, 1.2516, 1.2605-1.2620, 1.2691, 1.2786, 1.2863, 1.2981-1.2987. The Senkou Span B line (1.2745) and the Kijun-sen line (1.2818) can also serve as sources of signals. Don't forget to set a Stop Loss to breakeven if the price has moved in the intended direction by 20 pips. The Ichimoku indicator lines may move during the day, so this should be taken into account when determining trading signals.
On Thursday, there are no important fundamental and macroeconomic events lined up for the UK. The US docket will feature reports on the University of Michigan Consumer Sentiment Index and Industrial Production. Let's hope that these reports will not show disappointing values; otherwise, the dollar's rise will quickly come to an end.
Support and resistance levels are thick red lines near which the trend may end. They do not provide trading signals;
The Kijun-sen and Senkou Span B lines are the lines of the Ichimoku indicator, plotted to the 1H timeframe from the 4H one. They provide trading signals;
Extreme levels are thin red lines from which the price bounced earlier. They provide trading signals;
Yellow lines are trend lines, trend channels, and any other technical patterns;
Indicator 1 on the COT charts is the net position size for each category of traders;
Indicator 2 on the COT charts is the net position size for the Non-commercial group.
InstaForex analytical reviews will make you fully aware of market trends! Being an InstaForex client, you are provided with a large number of free services for efficient trading.


