 Stay
Stay 
Trading Conditions
Products
Tools


GBP/USD also showed very weak movements on Friday, although some of the day's reports could have triggered a stronger market reaction. For instance, the US industrial production report in particular. If the February figure exceeded forecasts by 0.1%, then the January figure was revised from -0.1% to -0.5%. Thus, market participants already had grounds to sell the dollar. The Consumer Sentiment Index from the University of Michigan also turned out to be weak. It stood at only 76.5 points against forecasts of 76.9. However, in the second half of the day, the dollar grew, if we can call a 25-point movement a rise.
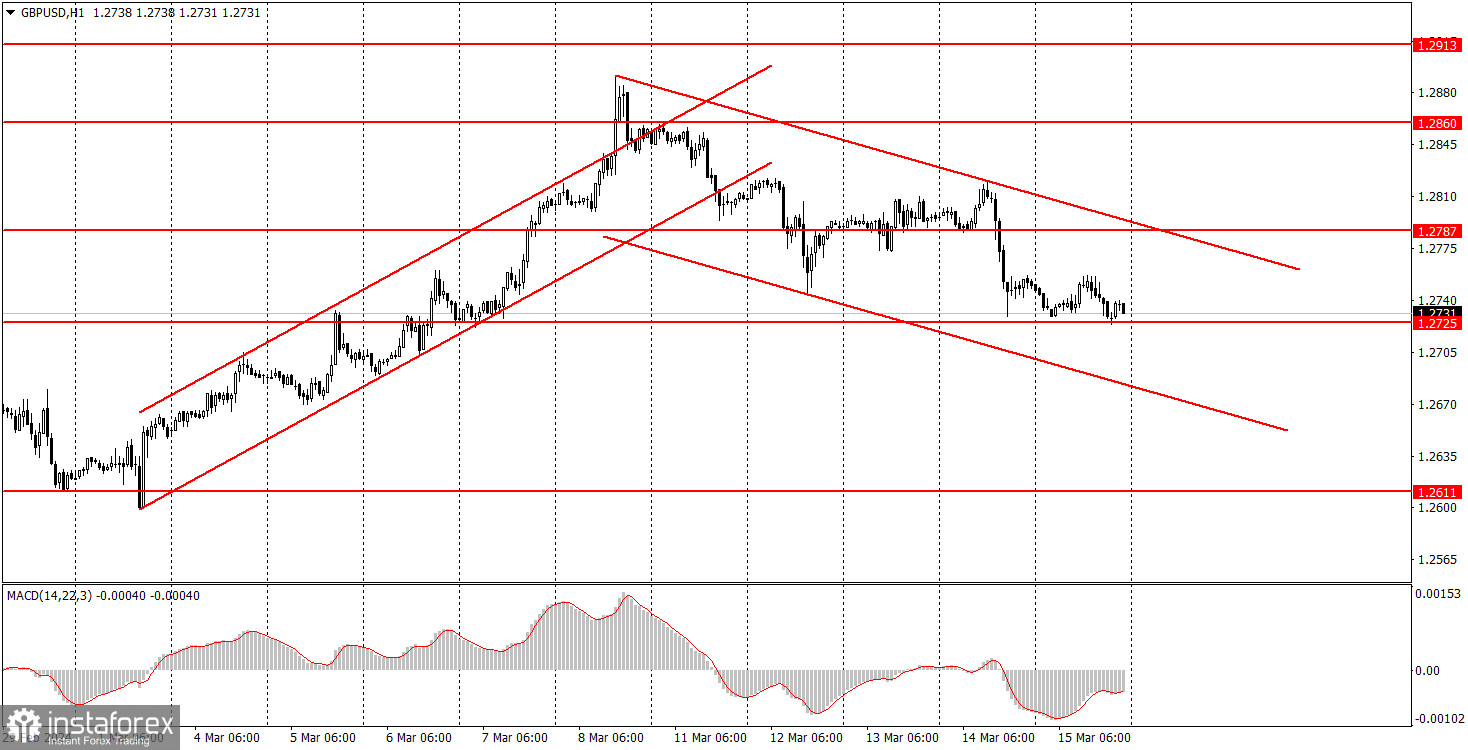
In general, the new downtrend persists, as shown by the descending channel. We don't expect the pound to start a new upward movement until the price consolidates above this mark. If we look beyond the current short-term trend, we don't expect the pound to rise further in the coming months. We still believe that the pound is significantly overvalued, while the dollar is too undervalued.
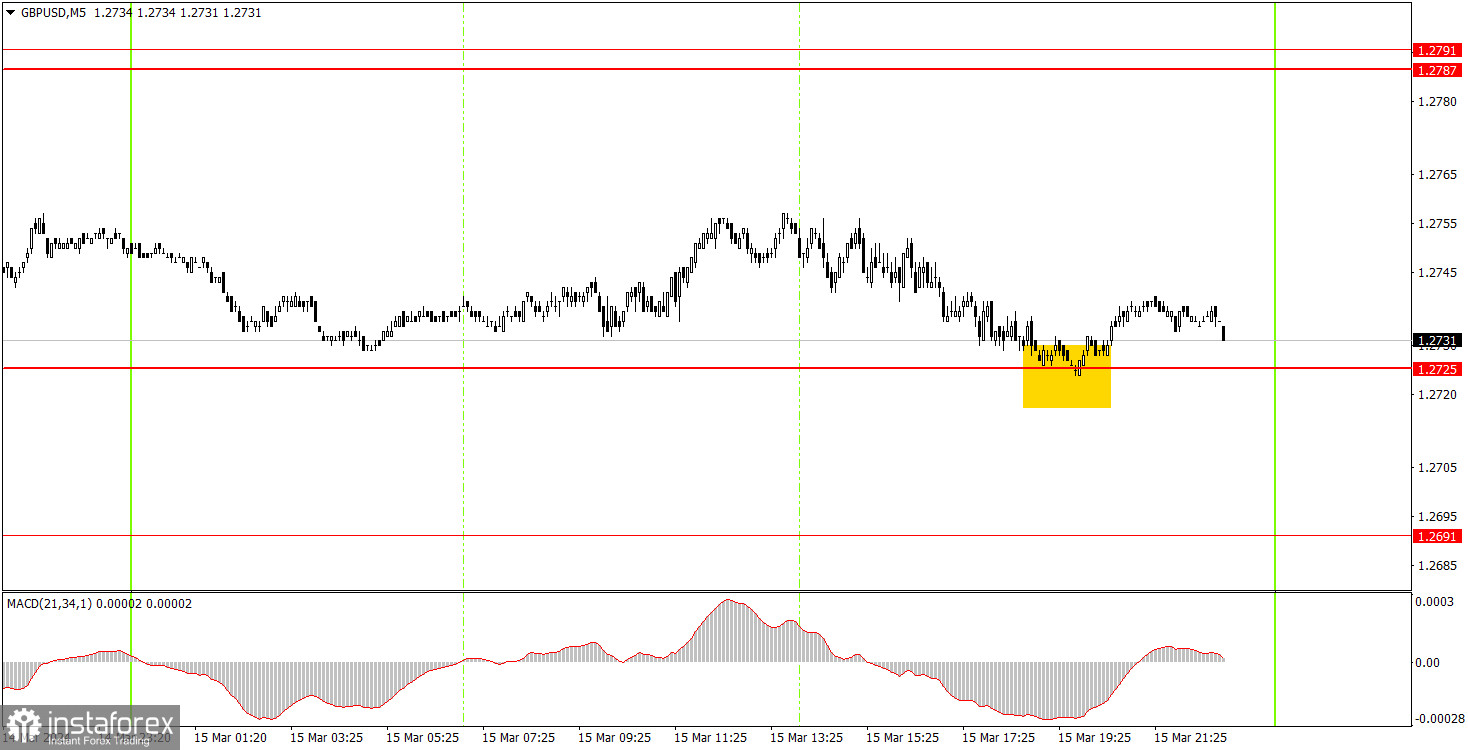
Only one trading signal was generated on the 5-minute timeframe. It was formed two hours before the market closed, so it was better not to enter the market with long positions.
On the hourly chart, GBP/USD has finally started to move downward. Since the pound doesn't have any logical reason to rise further, we encourage the British currency's decline. However, it is extremely difficult to confirm whether the market has turned firmly bearish based on just two trading days. The pound is still overvalued, and it has been that way for too long. The bullish bias remains intact in the medium term.
The key levels on the 5M chart are 1.2372-1.2387, 1.2457, 1.2502, 1.2544, 1.2605-1.2611, 1.2648, 1.2691, 1.2725, 1.2787-1.2791, 1.2848-1.2860, 1.2913, 1.2981-1.2993. On Monday, the US and UK economic calendars are relatively quiet. Therefore, we will likely see another "boring Monday" with no trends and low volatility.
1) Signal strength is determined by the time taken for its formation (either a bounce or level breach). A shorter formation time indicates a stronger signal.
2) If two or more trades around a certain level are initiated based on false signals, subsequent signals from that level should be disregarded.
3) In a flat market, any currency pair can produce multiple false signals or none at all. In any case, the flat trend is not the best condition for trading.
4) Trading activities are confined between the onset of the European session and mid-way through the U.S. session, after which all open trades should be manually closed.
5) On the 30-minute timeframe, trades based on MACD signals are only advisable amidst substantial volatility and an established trend, confirmed either by a trendline or trend channel.
6) If two levels lie closely together (ranging from 5 to 15 pips apart), they should be considered as a support or resistance zone.
Support and Resistance price levels can serve as targets when buying or selling. You can place Take Profit levels near them.
Red lines represent channels or trend lines, depicting the current market trend and indicating the preferable trading direction.
The MACD(14,22,3) indicator, encompassing both the histogram and signal line, acts as an auxiliary tool and can also be used as a signal source.
Significant speeches and reports (always noted in the news calendar) can profoundly influence the price dynamics. Hence, trading during their release calls for heightened caution. It may be reasonable to exit the market to prevent abrupt price reversals against the prevailing trend.
Beginners should always remember that not every trade will yield profit. Establishing a clear strategy coupled with sound money management is the cornerstone of sustained trading success.
InstaForex analytical reviews will make you fully aware of market trends! Being an InstaForex client, you are provided with a large number of free services for efficient trading.


