 Stay
Stay 
Trading Conditions
Products
Tools


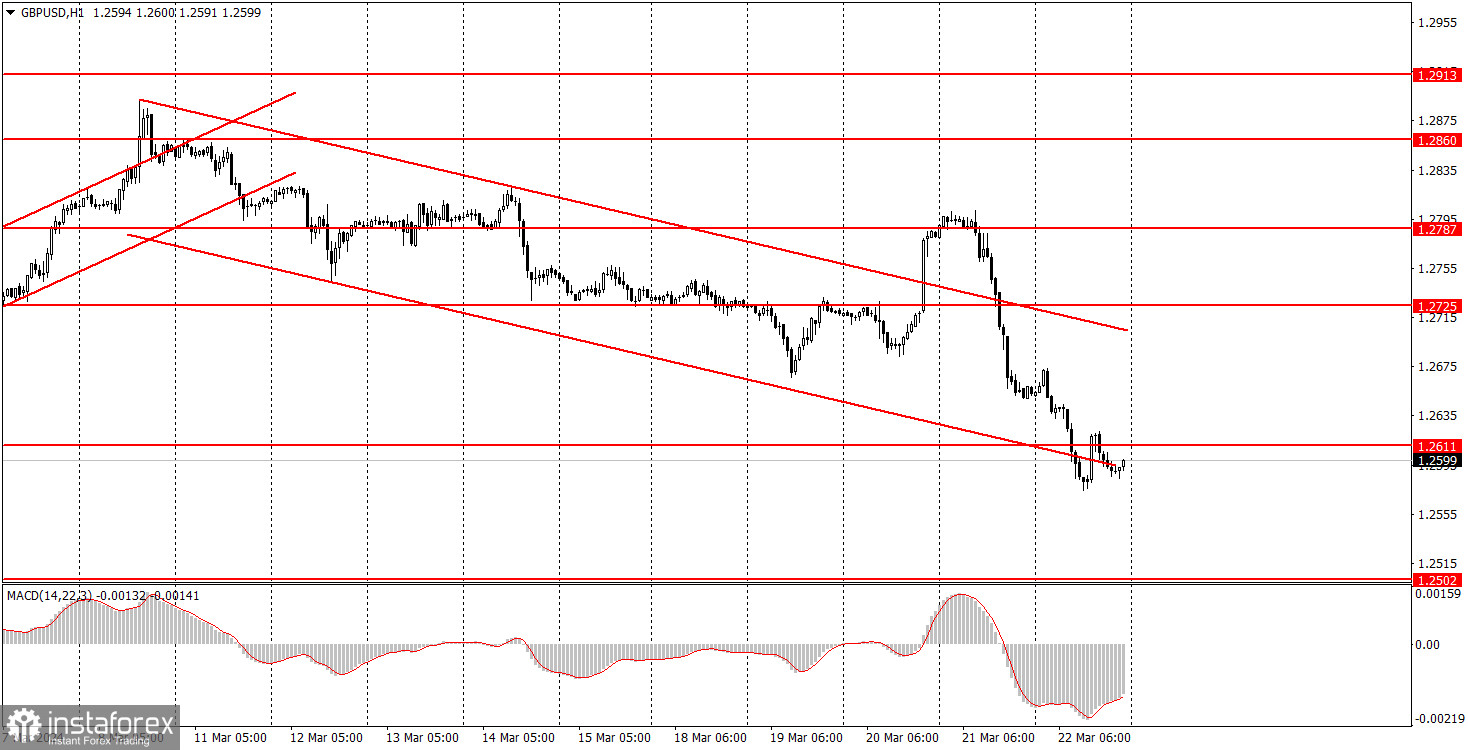
GBP/USD continued to trade lower on Friday, which had nothing to do with the day's macro data. The dollar continued to strengthen against the backdrop of the Bank of England and Federal Reserve meetings, which took place on Thursday and Wednesday respectively. Since the market initially misinterpreted the results of the US central bank's meeting, we saw a double downward movement on Thursday and Friday. The UK retail sales report had no impact on market sentiment. If anything, it should have supported the pound, as its values turned out to be better than forecasts. However, the pair fell for most of the day.
Although the descending channel was broken on Wednesday evening, those movements were impulsive, so we will not take them into account. Therefore, the descending channel remains relevant, supporting sellers and further strengthening the US dollar. We believe that the pound has a good potential to fall.
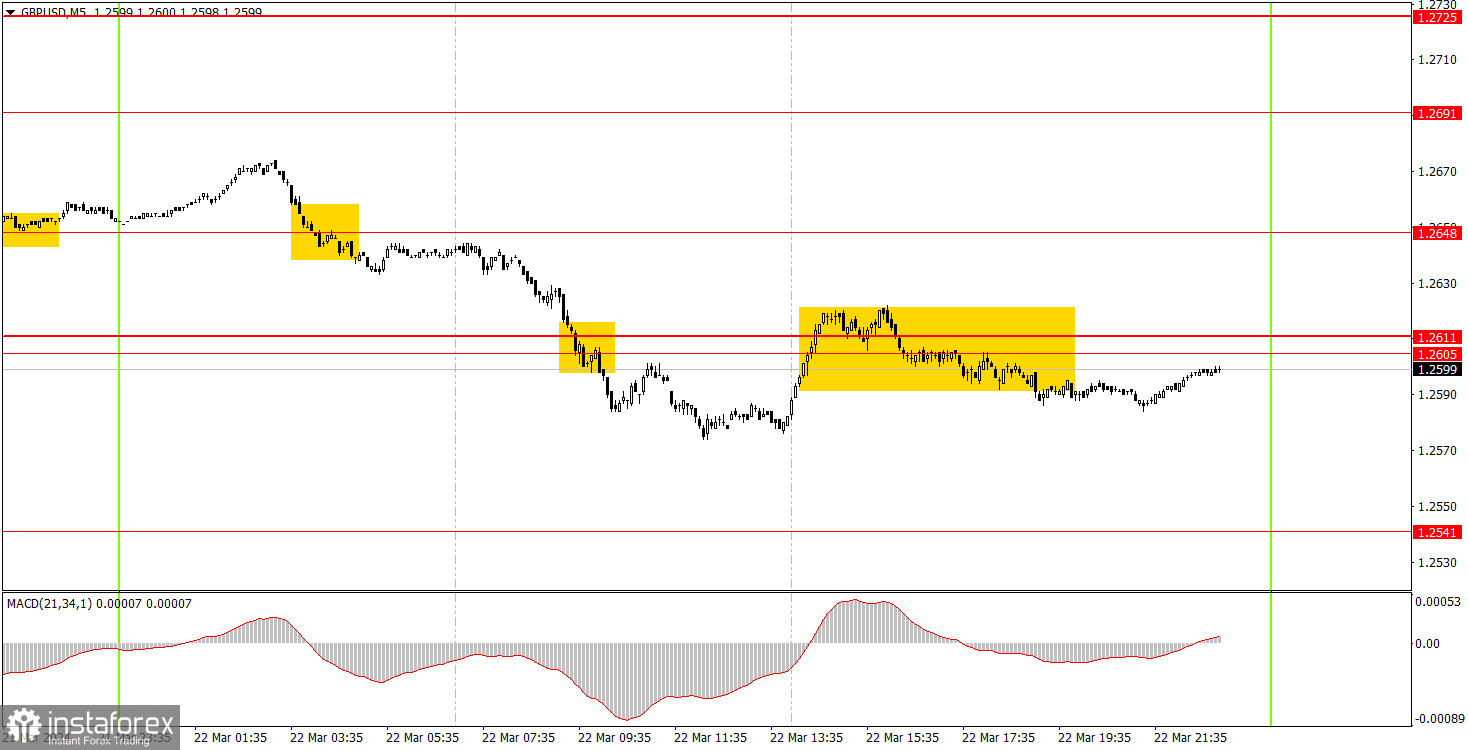
Several trading signals were generated on the 5-minute timeframe. Initially, the pair surpassed the level of 1.2648, then the range of 1.2605-1.2611, and finally rebounded from the same range. The last signal was not precise, but the movements during the US session were generally very weak. In any case, beginners had enough of the first two signals to make a profit. The short position should have been opened at the beginning of the European session, which brought a profit of about 50 pips. No buy signals were formed during the day, so positions should have been manually closed closer to the evening.
On the hourly chart, GBP/USD has resumed its downward movement. Unfortunately, the market continues to trade erratically quite often, which at the very least confuses traders, especially beginners. Nevertheless, the British currency has been declining in recent weeks, which is quite encouraging. The downtrend persists.
The key levels on the 5M chart are 1.2372-1.2387, 1.2457, 1.2502, 1.2544, 1.2605-1.2611, 1.2648, 1.2691, 1.2725, 1.2787-1.2791, 1.2848-1.2860, 1.2913, 1.2981-1.2993. There are no important events scheduled in the UK and the US on Monday. Therefore, volatility may decrease, but the pound still has the tendency to fall, while the dollar will rise, especially after the BoE and the Fed meetings.
1) Signal strength is determined by the time taken for its formation (either a bounce or level breach). A shorter formation time indicates a stronger signal.
2) If two or more trades around a certain level are initiated based on false signals, subsequent signals from that level should be disregarded.
3) In a flat market, any currency pair can produce multiple false signals or none at all. In any case, the flat trend is not the best condition for trading.
4) Trading activities are confined between the onset of the European session and mid-way through the U.S. session, after which all open trades should be manually closed.
5) On the 30-minute timeframe, trades based on MACD signals are only advisable amidst substantial volatility and an established trend, confirmed either by a trendline or trend channel.
6) If two levels lie closely together (ranging from 5 to 15 pips apart), they should be considered as a support or resistance zone.
Support and Resistance price levels can serve as targets when buying or selling. You can place Take Profit levels near them.
Red lines represent channels or trend lines, depicting the current market trend and indicating the preferable trading direction.
The MACD(14,22,3) indicator, encompassing both the histogram and signal line, acts as an auxiliary tool and can also be used as a signal source.
Significant speeches and reports (always noted in the news calendar) can profoundly influence the price dynamics. Hence, trading during their release calls for heightened caution. It may be reasonable to exit the market to prevent abrupt price reversals against the prevailing trend.
Beginners should always remember that not every trade will yield profit. Establishing a clear strategy coupled with sound money management is the cornerstone of sustained trading success.
InstaForex analytical reviews will make you fully aware of market trends! Being an InstaForex client, you are provided with a large number of free services for efficient trading.


