 Stay
Stay 
Trading Conditions
Products
Tools


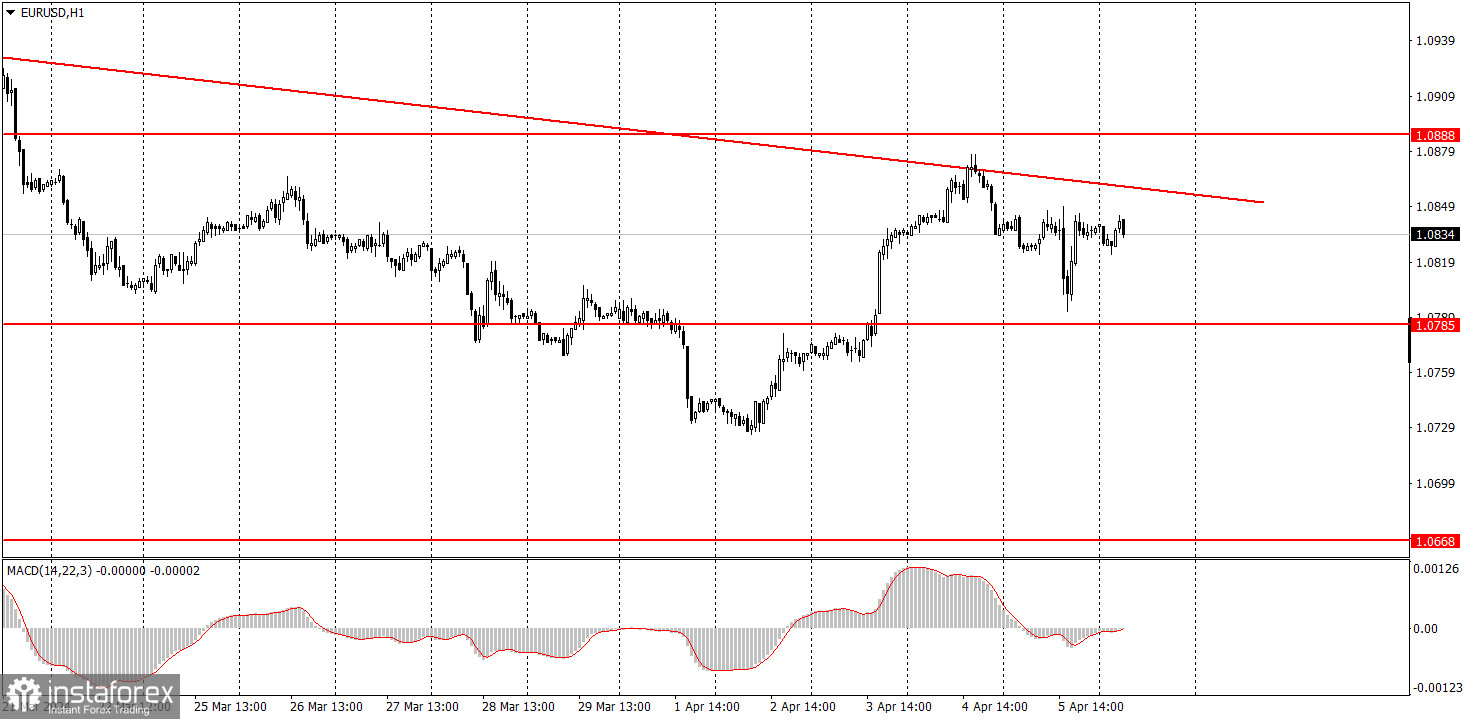
The EUR/USD pair tried to resume its downtrend after trading higher for several consecutive days. And it was completely illogical for the pair to rise. Let us remind you that most of last week's U.S. reports were supposed to support the dollar. However, for some reason the market mostly sold the dollar. Maybe it was a technical correction, and this week, the dollar will rise, which would be logical and natural. But last week there was no logic behind the movements.
On Friday, two key reports on the labor market and unemployment both turned out to be better than forecasts. Nonfarm payrolls exceeded forecasts by 100K, and the unemployment rate fell against forecasts. However, the dollar only rose for an hour, after which it returned to its original positions. As long as the price does not overcome the trend line, the downtrend persists. But the dollar should already rise.
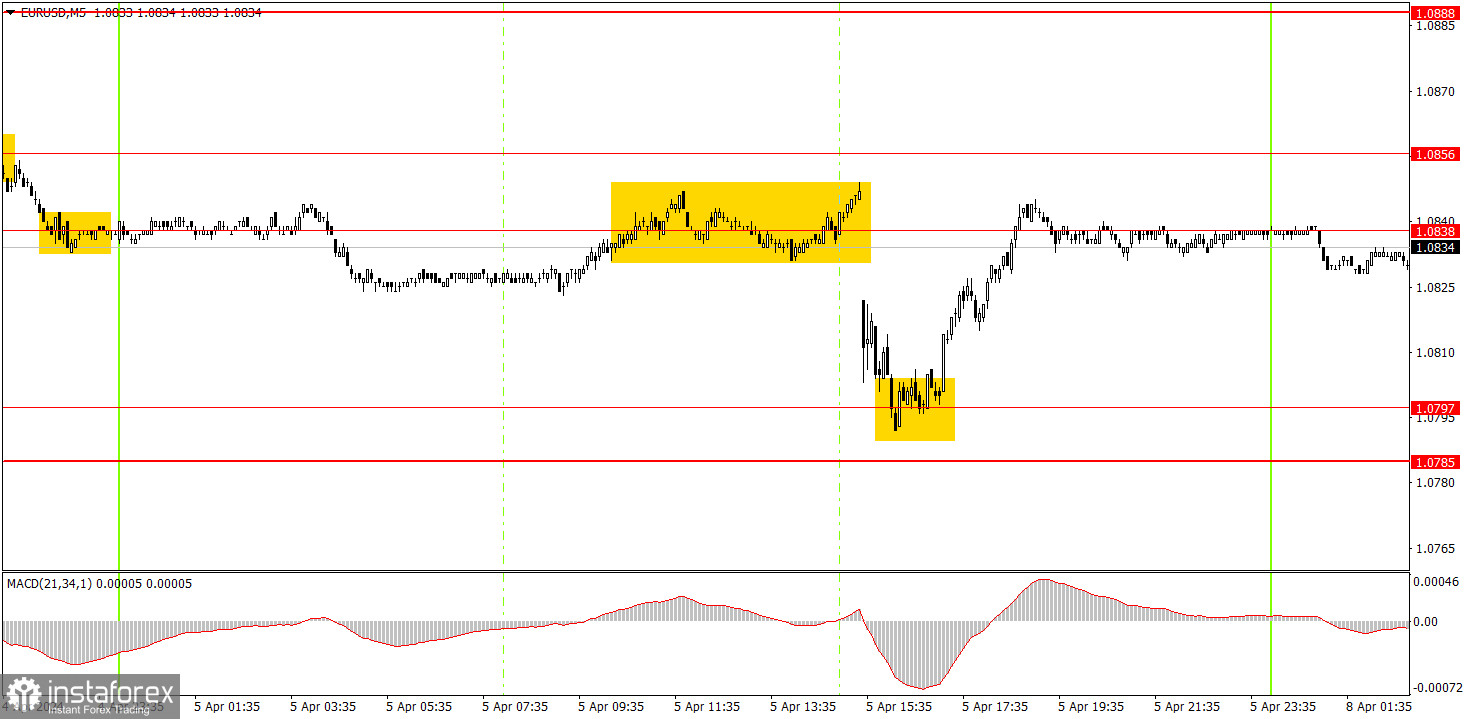
The 5-minute timeframe showed mixed signals. The first sell signal formed in the range of 1.0838-1.0856, but there was no opportunity to act on it as the price immediately fell by several tens of points - the U.S. reports were released. Then there was a bounce from the level of 1.0797, but it wasn't a good idea to buy the pair on strong Nonfarm Payrolls and unemployment data. Traders could have executed this signal and they would have made a profit, but we would not have opened a trade on the dollar's decline when the reports turned out to be stronger than expected.
On the hourly chart, the downtrend persists, but EUR/USD exhibited unnecessary growth last week. We believe that the euro should fall further, as the price is still too high, and the trend is generally bearish. Unfortunately, the market doesn't always want to trade the pair in a logical manner, and occasionally, it exhibits illogical rallies.
Today, it may be worth trying to trade on dips again as the price has bounced off the trendline. If the price breaches the trend line, the downtrend will be broken, and the euro may rise even without fundamental support.
The key levels on the 5M chart are 1.0568, 1.0611-1.0618, 1.0668, 1.0725, 1.0785-1.0797, 1.0838-1.0856, 1.0888-1.0896, 1.0940, 1.0971-1.0981, 1.1011, 1.1043, 1.1091. There are no important events on Monday, so we can expect low volatility, and the pair may even show erratic movements.
1) Signal strength is determined by the time taken for its formation (either a bounce or level breach). A shorter formation time indicates a stronger signal.
2) If two or more trades around a certain level are initiated based on false signals, subsequent signals from that level should be disregarded.
3) In a flat market, any currency pair can produce multiple false signals or none at all. In any case, the flat trend is not the best condition for trading.
4) Trading activities are confined between the onset of the European session and mid-way through the U.S. session, after which all open trades should be manually closed.
5) On the 30-minute timeframe, trades based on MACD signals are only advisable amidst substantial volatility and an established trend, confirmed either by a trendline or trend channel.
6) If two levels lie closely together (ranging from 5 to 15 pips apart), they should be considered as a support or resistance zone.
Support and Resistance price levels can serve as targets when buying or selling. You can place Take Profit levels near them.
Red lines represent channels or trend lines, depicting the current market trend and indicating the preferable trading direction.
The MACD(14,22,3) indicator, encompassing both the histogram and signal line, acts as an auxiliary tool and can also be used as a signal source.
Significant speeches and reports (always noted in the news calendar) can profoundly influence the price dynamics. Hence, trading during their release calls for heightened caution. It may be reasonable to exit the market to prevent abrupt price reversals against the prevailing trend.
Beginning traders should always remember that not every trade will yield profit. Establishing a clear strategy coupled with sound money management is the cornerstone of sustained trading success.
InstaForex analytical reviews will make you fully aware of market trends! Being an InstaForex client, you are provided with a large number of free services for efficient trading.


