 Stay
Stay 
Trading Conditions
Products
Tools


The GBP/USD pair also showed nothing but erratic movements on Friday. Once again, the dollar failed to rise when it clearly should have shown growth. This might seem strange for the EUR/USD pair, but this often happens for the GBP/USD pair. The British pound is still trading within a sideways channel on the daily chart, unable to overcome the level of 1.2500, so it was quite predictable that the dollar would fail.
The American economy once again demonstrated its strength last week. The labor market showed growth, unemployment declined, PMI data remained above the 50.0 level, the number of job vacancies increased, and the ADP report showed a positive trend. But unfortunately, even if these are important reports, the market still refuses to buy the dollar. The pair may continue to move within the range of 1.25-1.28, ignoring the macroeconomic and fundamental backdrop.
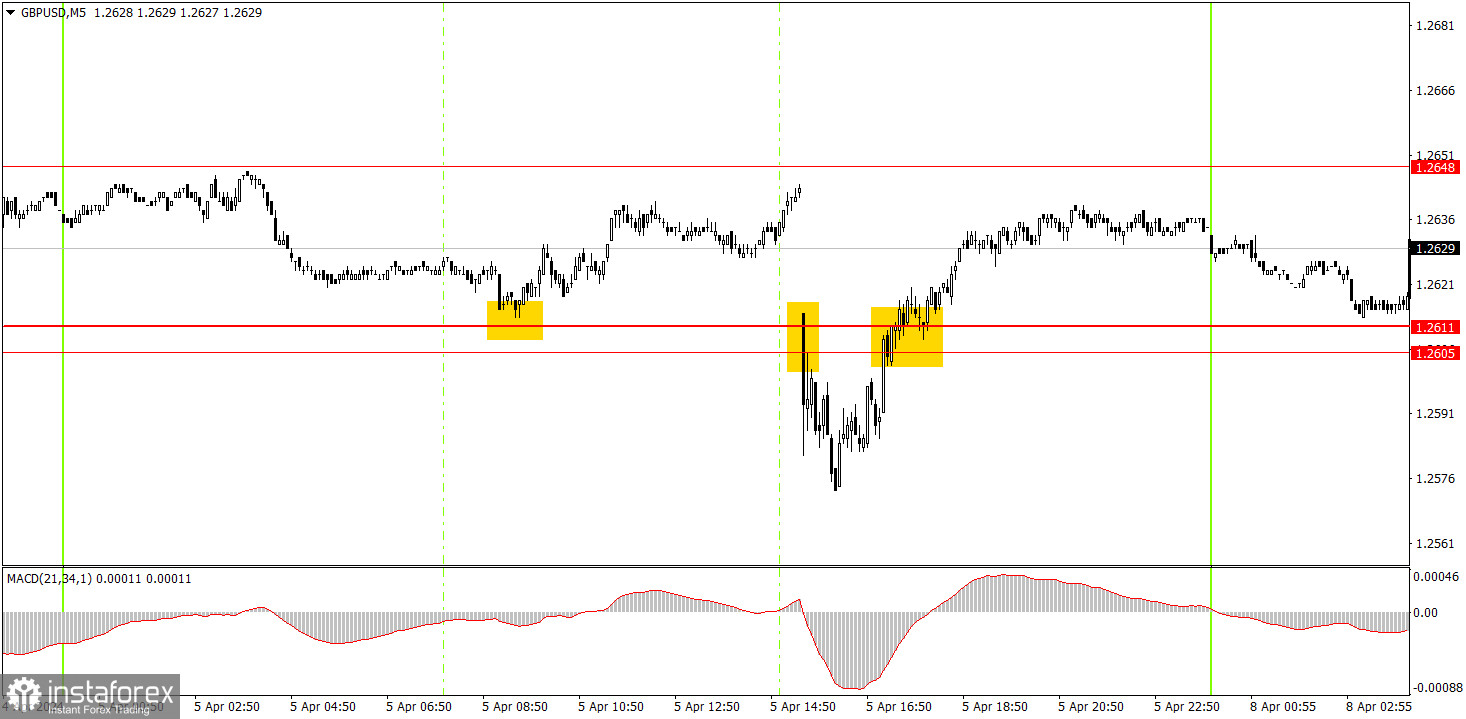
Several signals were generated on the 5-minute timeframe. Novice traders could open long positions on the rebound from the level of 1.2611 during the European session. Before the release of the Nonfarm Payrolls and unemployment reports, the trade should have been manually closed. The profit from it was about 15 pips. Then there was consolidation below the range of 1.2605-1.2611, which could also be executed. Unfortunately, the dollar quickly stopped rising, so the pair did not fall further. The trade closed at the Stop Loss without profit. It was no longer advisable to work out the last buy signal, as the last two signals did not lead to the pair reaching the nearest target levels.
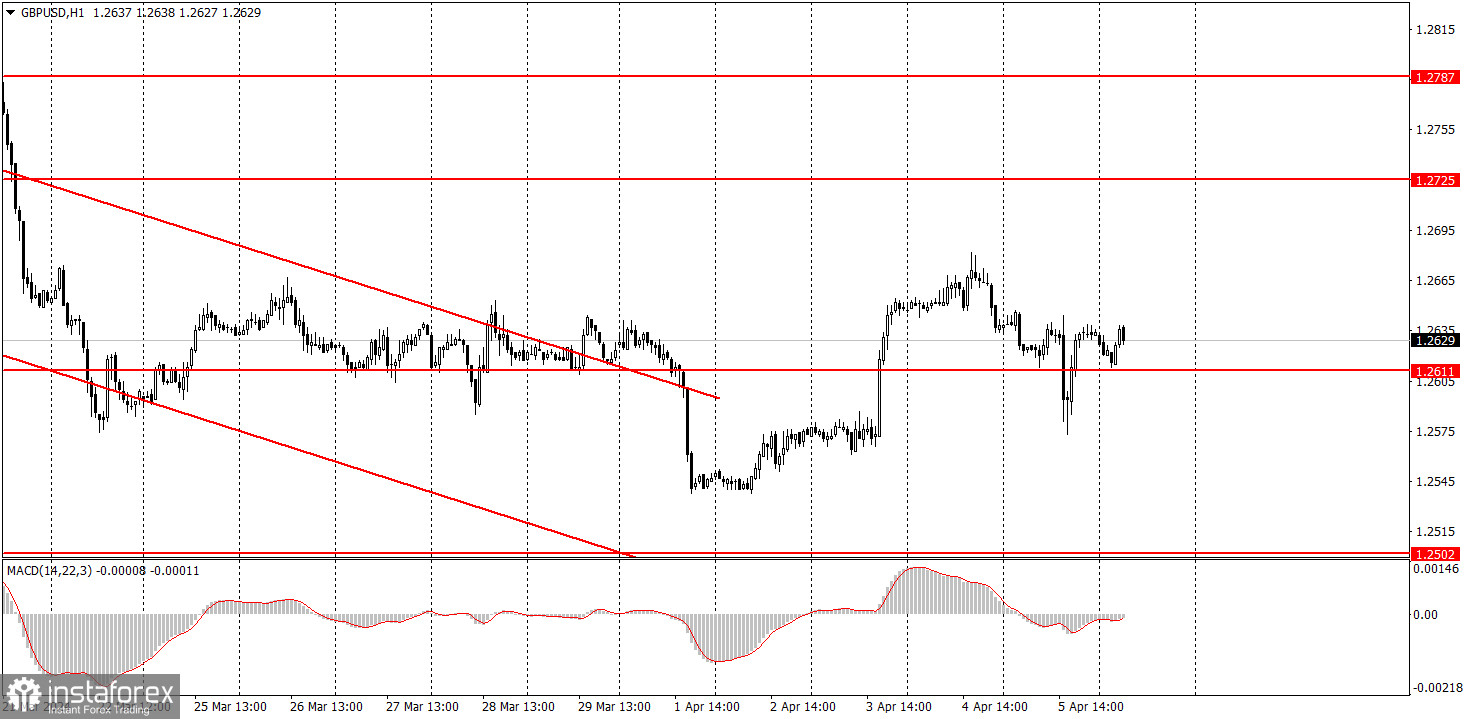
On the hourly chart, the GBP/USD pair is likely starting a new upward movement within the flat range. Unfortunately, the market doesn't always trade in a logical manner, and on a global scale, the flat persists. Therefore, in the coming weeks, we can expect the pair to rise towards the 1.2800 level, but it's still showing erratic movements, with hardly any logic behind them.
On Monday, novice traders can use the range of 1.2605-1.2611 as a reference point, but today there is a high probability of a low-volatility flat, so we shouldn't expect strong movements.
The key levels on the 5M chart are 1.2372-1.2387, 1.2457, 1.2502, 1.2544, 1.2605-1.2611, 1.2648, 1.2691, 1.2725, 1.2787-1.2791, 1.2848-1.2860, 1.2913, 1.2981-1.2993. There are no important events on Monday, so there won't be much for the market to react to during the day. However, last week showed us that the fundamental background has almost no impact on the pound.
1) Signal strength is determined by the time taken for its formation (either a bounce or level breach). A shorter formation time indicates a stronger signal.
2) If two or more trades around a certain level are initiated based on false signals, subsequent signals from that level should be disregarded.
3) In a flat market, any currency pair can produce multiple false signals or none at all. In any case, the flat trend is not the best condition for trading.
4) Trading activities are confined between the onset of the European session and mid-way through the U.S. session, after which all open trades should be manually closed.
5) On the 30-minute timeframe, trades based on MACD signals are only advisable amidst substantial volatility and an established trend, confirmed either by a trendline or trend channel.
6) If two levels lie closely together (ranging from 5 to 15 pips apart), they should be considered as a support or resistance zone.
Support and Resistance price levels can serve as targets when buying or selling. You can place Take Profit levels near them.
Red lines represent channels or trend lines, depicting the current market trend and indicating the preferable trading direction.
The MACD(14,22,3) indicator, encompassing both the histogram and signal line, acts as an auxiliary tool and can also be used as a signal source.
Significant speeches and reports (always noted in the news calendar) can profoundly influence the price dynamics. Hence, trading during their release calls for heightened caution. It may be reasonable to exit the market to prevent abrupt price reversals against the prevailing trend.
Beginners should always remember that not every trade will yield profit. Establishing a clear strategy coupled with sound money management is the cornerstone of sustained trading success.
InstaForex analytical reviews will make you fully aware of market trends! Being an InstaForex client, you are provided with a large number of free services for efficient trading.

