 Stay
Stay 
Trading Conditions
Products
Tools


EUR/USD returned to its usual mode of movement amid low volatility on Monday. In general, if we regularly observe low volatility even on days when there is a strong fundamental background, then what can we possibly say about Mondays when there are usually no news or reports? Yesterday, the German industrial production report was published, which turned out to be better than forecasts. Perhaps the euro rose by about 20 pips because of it. However, we need to know which direction the price moved, and how strong the movements are. If the pair shows weak movements, then it would not be possible to make profit from it no matter which way the pair went.
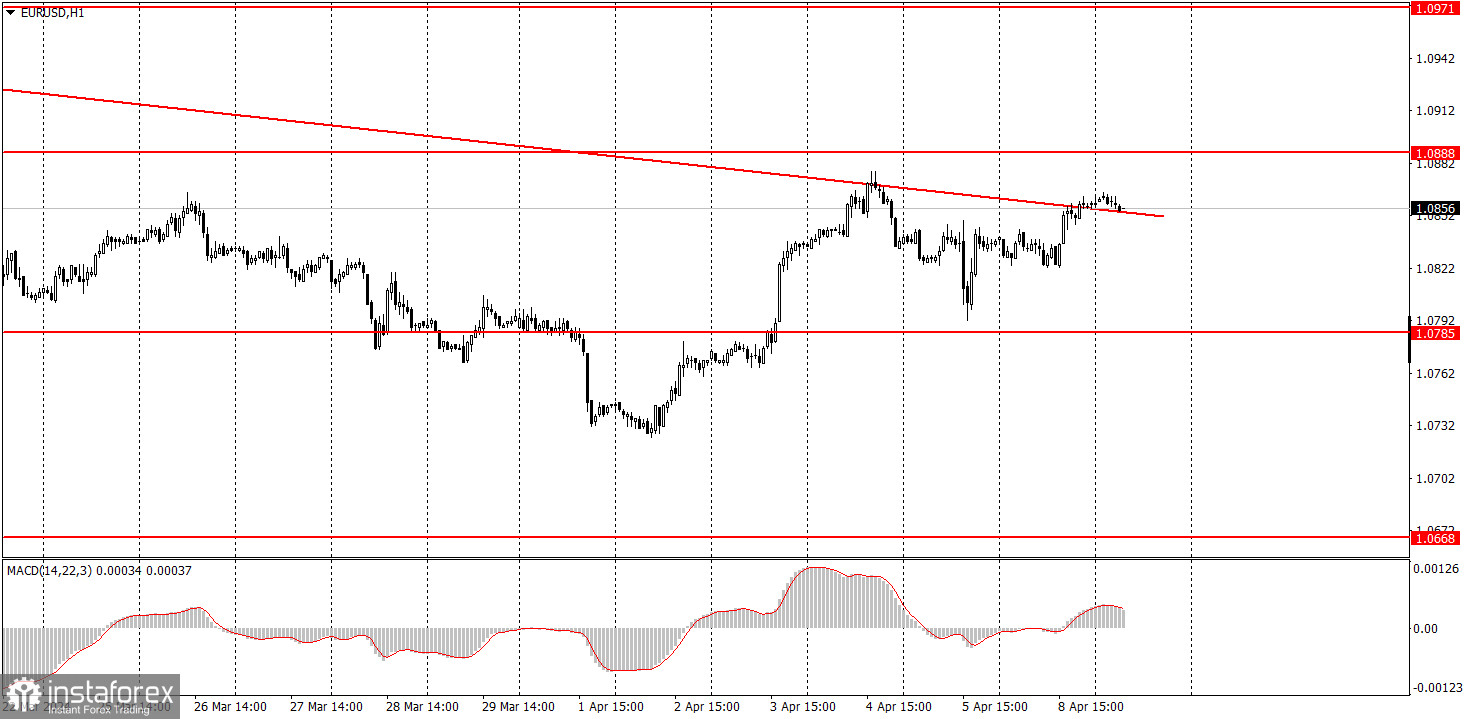
Yesterday, the pair breached the descending trend line for the third time. So far, everything is pointing towards the end of the downtrend for the time being. The euro has no grounds to exhibit growth, so practically any rise would seem illogical.
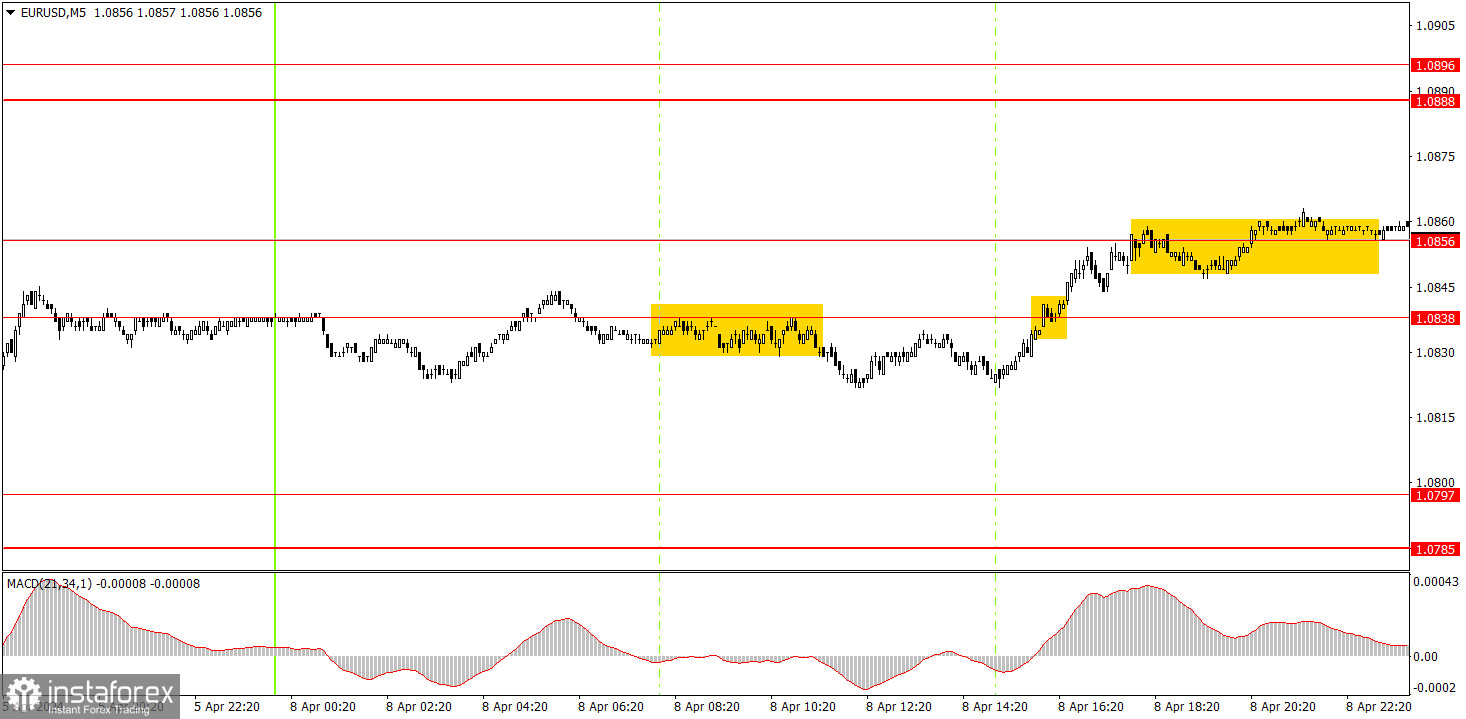
Two trading signals were generated on the 5-minute timeframe, but it was impossible to make profit from them. Initially, the pair bounced off the level of 1.0838 and managed to fall by 5 pips. Then there was an upward breakthrough, and the price managed to rise by 10 pips. Any trading signals will not yield profits with such movements.
On the hourly chart, the downtrend persists, but it will likely end soon. The market has started to buy euros for no particular reason again. We believe that the euro should continue to fall, as it is still too high, and the global trend is downward. Unfortunately, the market doesn't always want to trade the pair in a logical manner, and occasionally, it exhibits unreasonable rallies.
Today, you may try to trade from the nearest levels. Since the pair will likely go through weak volatility, we shouldn't expect high profits from any signals or trades.
The key levels on the 5M chart are 1.0568, 1.0611-1.0618, 1.0668, 1.0725, 1.0785-1.0797, 1.0838-1.0856, 1.0888-1.0896, 1.0940, 1.0971-1.0981, 1.1011, 1.1043, 1.1091. There are no important events on Tuesday, so we can expect low volatility, and the pair may show erratic movements.
1) Signal strength is determined by the time taken for its formation (either a bounce or level breach). A shorter formation time indicates a stronger signal.
2) If two or more trades around a certain level are initiated based on false signals, subsequent signals from that level should be disregarded.
3) In a flat market, any currency pair can produce multiple false signals or none at all. In any case, the flat trend is not the best condition for trading.
4) Trading activities are confined between the onset of the European session and mid-way through the U.S. session, after which all open trades should be manually closed.
5) On the 30-minute timeframe, trades based on MACD signals are only advisable amidst substantial volatility and an established trend, confirmed either by a trendline or trend channel.
6) If two levels lie closely together (ranging from 5 to 15 pips apart), they should be considered as a support or resistance zone.
Support and Resistance price levels can serve as targets when buying or selling. You can place Take Profit levels near them.
Red lines represent channels or trend lines, depicting the current market trend and indicating the preferable trading direction.
The MACD(14,22,3) indicator, encompassing both the histogram and signal line, acts as an auxiliary tool and can also be used as a signal source.
Significant speeches and reports (always noted in the news calendar) can profoundly influence the price dynamics. Hence, trading during their release calls for heightened caution. It may be reasonable to exit the market to prevent abrupt price reversals against the prevailing trend.
Beginning traders should always remember that not every trade will yield profit. Establishing a clear strategy coupled with sound money management is the cornerstone of sustained trading success.
InstaForex analytical reviews will make you fully aware of market trends! Being an InstaForex client, you are provided with a large number of free services for efficient trading.


