 Stay
Stay 
Trading Conditions
Products
Tools


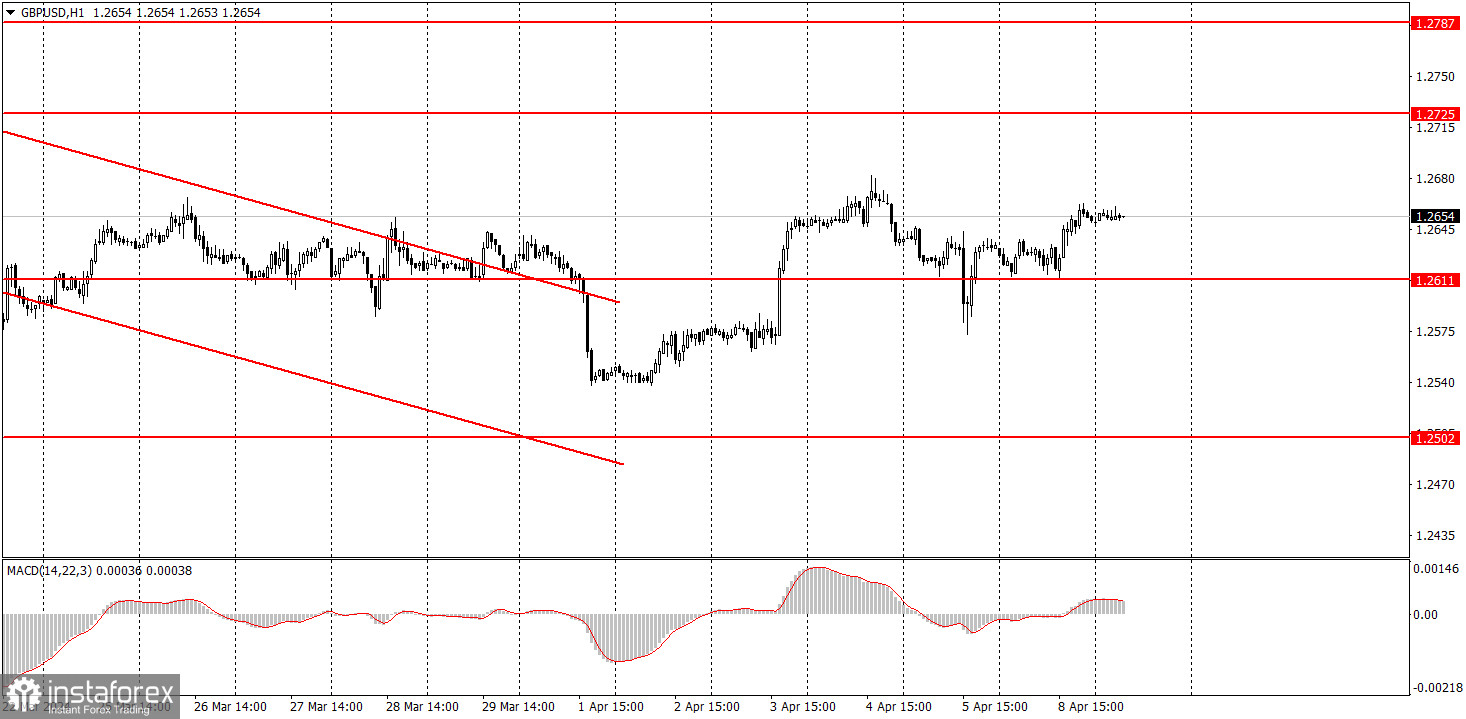
The GBP/USD pair edged up on Monday, which doesn't mean anything significant for the technical picture. Take note that the main point is the flat on the 24-hour timeframe. Not long ago, the price reversed near the lower boundary of the sideways channel at 1.25-1.28, so now, over the next few weeks, we may observe steady upward movement towards the level of 1.2800. However, we will remind you that movements within the sideways channel are chaotic and there is no logic behind them. Last week, the pound traded higher, even though almost all the fundamental and macroeconomic factors supported the dollar.
Therefore, the pound is still the least attractive currency right now, with an unknown force that prevents it from falling. Even if inflation in the US increases again this week, this report will not change the market sentiment, as investors simply refuse to buy the dollar.
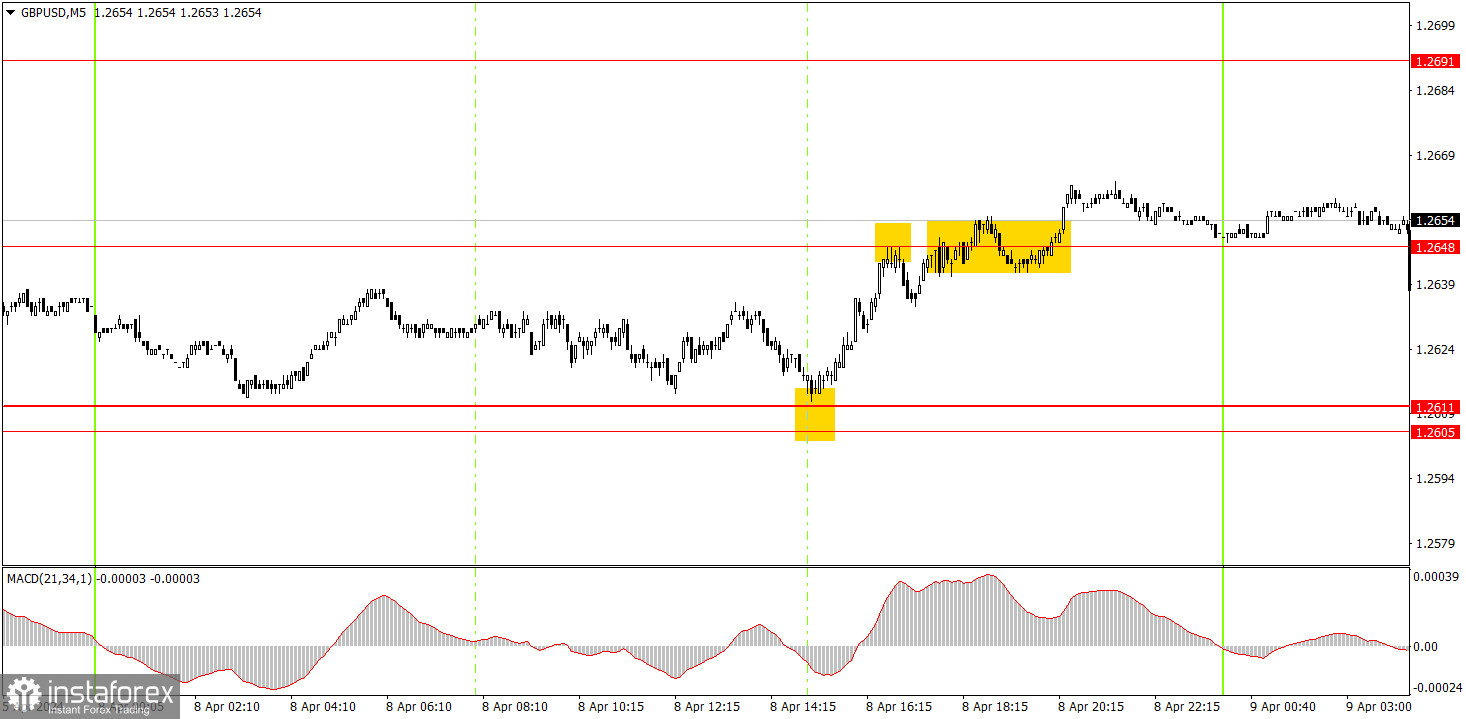
One trading signal was formed on the 5-minute timeframe. At the beginning of the U.S. trading session, the price rebounded from the level of 1.2611, after which it managed to rise to the level of 1.2648. Novice traders could earn about 15-20 pips from a long position. The rebound from the level of 1.2648 suggested a price reversal, but a short position did not yield profits as the price continued to rise. As a result, the day ended with small profit.
On the hourly chart, the GBP/USD pair is probably starting a new upward movement within the flat range. Unfortunately, the market doesn't always trade in a logical manner, and on a global scale, the flat persists. Therefore, in the coming weeks, we can expect the pair to rise towards the 1.2800 level, but it is still showing erratic movements with hardly any logic behind them.
On Tuesday, novice traders may trade bullish since the price overcame the level of 1.2648 yesterday. However, there is a high probability of the pair experiencing a low-volatility flat, so we shouldn't expect strong movements.
The key levels on the 5M chart are 1.2372-1.2387, 1.2457, 1.2502, 1.2544, 1.2605-1.2611, 1.2648, 1.2691, 1.2725, 1.2787-1.2791, 1.2848-1.2860, 1.2913, 1.2981-1.2993. There are no important events on Tuesday, so there won't be much for the market to react to during the day. However, last week showed us that the fundamental background has almost no influence on the pound.
1) Signal strength is determined by the time taken for its formation (either a bounce or level breach). A shorter formation time indicates a stronger signal.
2) If two or more trades around a certain level are initiated based on false signals, subsequent signals from that level should be disregarded.
3) In a flat market, any currency pair can produce multiple false signals or none at all. In any case, the flat trend is not the best condition for trading.
4) Trading activities are confined between the onset of the European session and mid-way through the U.S. session, after which all open trades should be manually closed.
5) On the 30-minute timeframe, trades based on MACD signals are only advisable amidst substantial volatility and an established trend, confirmed either by a trendline or trend channel.
6) If two levels lie closely together (ranging from 5 to 15 pips apart), they should be considered as a support or resistance zone.
Support and Resistance price levels can serve as targets when buying or selling. You can place Take Profit levels near them.
Red lines represent channels or trend lines, depicting the current market trend and indicating the preferable trading direction.
The MACD(14,22,3) indicator, encompassing both the histogram and signal line, acts as an auxiliary tool and can also be used as a signal source.
Significant speeches and reports (always noted in the news calendar) can profoundly influence the price dynamics. Hence, trading during their release calls for heightened caution. It may be reasonable to exit the market to prevent abrupt price reversals against the prevailing trend.
Beginners should always remember that not every trade will yield profit. Establishing a clear strategy coupled with sound money management is the cornerstone of sustained trading success.
InstaForex analytical reviews will make you fully aware of market trends! Being an InstaForex client, you are provided with a large number of free services for efficient trading.

