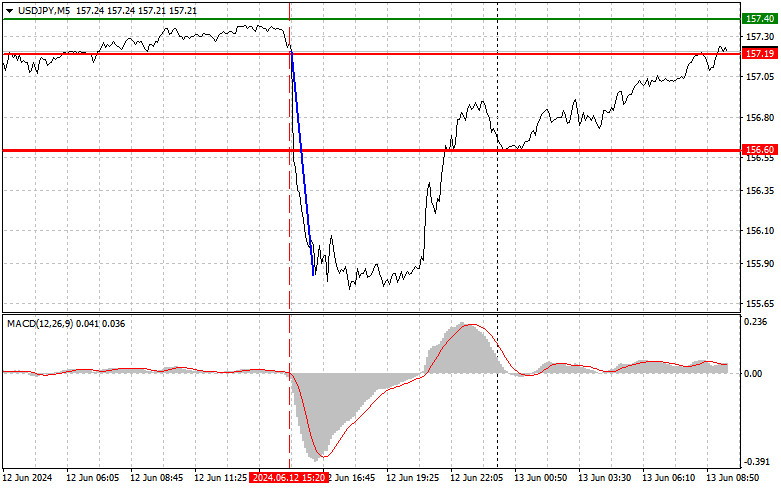
This information is provided to retail and professional clients as part of marketing communication. It does not contain and should not be construed as containing investment advice or investment recommendation or an offer or solicitation to engage in any transaction or strategy in financial instruments. Past performance is not a guarantee or prediction of future performance. Instant Trading EU Ltd. makes no representation and assumes no liability as to the accuracy or completeness of the information provided, or any loss arising from any investment based on analysis, forecast or other information provided by an employee of the Company or otherwise. Full disclaimer is available here.
Popular analytics
The price test of 157.19 occurred at a time when the MACD indicator was just starting to move down from the zero mark, which confirmed the entry point to sell.
EUR/USD and GBP/USD: Technical analysis on June 13
The bulls have returned to the area of different levels on the higher timeframes (1.0795 – 1.0829). These levels exert influence on the current situation's progress. The bulls' objective.
Technical Analysis of Intraday Price Movement of GBP/JPY Cross Currency Pairs, Thursday June 13 2024.
With the condition of the 50 EMA which is above the 200 EMA (Golden Cross) on the 4 hour chart of the GBP/JPY cross currency pair, we can find.
Technical Analysis of Intraday Price Movement of Nasdaq 100 Index, Thursday June 13 2024.
With the appearance of deviations between price movements and the Stochastic Oscillator indicator and the appearance of the Bearish Y Wave Ichimoku Projection Wave pattern, in the near future.
Forecast for GBP/USD on June 13, 2024
GBP/USD Yesterday's economic reports showed weak figures for construction, manufacturing, and trade balance in the UK. However, the dramatic decline in the US CPI pulled the pound above the target.
Overview of EUR/USD on June 13. U.S. inflation has thrown the market into a state of euphoria
On Wednesday, EUR/USD showed a strong upward movement throughout the day. While the movement was extremely weak in the first half of the day, the market went off the rails.
A decline in US inflation will allow the yen to initiate a bearish USD/JPY reversal
The US Consumer Price Index declined to 3.3% on a yearly basis in May from 3.4% in April, while the core index fell even more sharply from 3.6% to 3.4%.
Trading Signals for BITCOIN (BTC/USD) for June 12-14, 2024: buy above $68,610 (6/8 Murray- 21 SMA)
Bitcoin is trading around $69,372 with good bullish momentum reinforced by the US inflation data. The technical rebound that occurred yesterday during the American session when it reached.
Technical Analysis of Intraday Price Movement of AUD/CHF Cross Currency Pairs, Wednesday June 12, 2024.
Eventhough the 50 EMA is below the 200 EMA which indicates that Sellers dominate the AUD/CHF currency pair on the 4-hour chart, the presence of the Y-Wave Ichimoku Projection pattern.
Show more
This section is updated daily and contains market analysis prepared by professional analysts on behalf of InstaForex. Each of the specialists presents analytical reviews in accordance with his/her vision of the current situation on the foreign exchange and other markets. However, the outlooks below are neither recommendations nor instructions to any actions. They contain analysis of the current situation on financial markets. In some cases, analysts' opinions about current market conditions may differ.