 Stay
Stay 
Trading Conditions
Products
Tools


On Friday, the GBP/USD pair continued its downward trend, which is not surprising given that the pound sterling had been falling throughout the week, even on days without any significant local catalysts. The release of highly positive U.S. labor market and unemployment reports on Friday further strengthened the dollar.
While the euro managed to recover slightly after a nearly 100-pip drop, the pound continued to decline until the market closed for the weekend. We have repeatedly highlighted the pound's vulnerability, which could lead to challenges in the future. We also warned that the market has just begun to factor in the Bank of England's monetary policy easing. As we anticipated for 2024, the pound is now falling daily. Consequently, the target of 1.1800, which we have been discussing for at least six months, appears much more achievable than it did a few months ago.
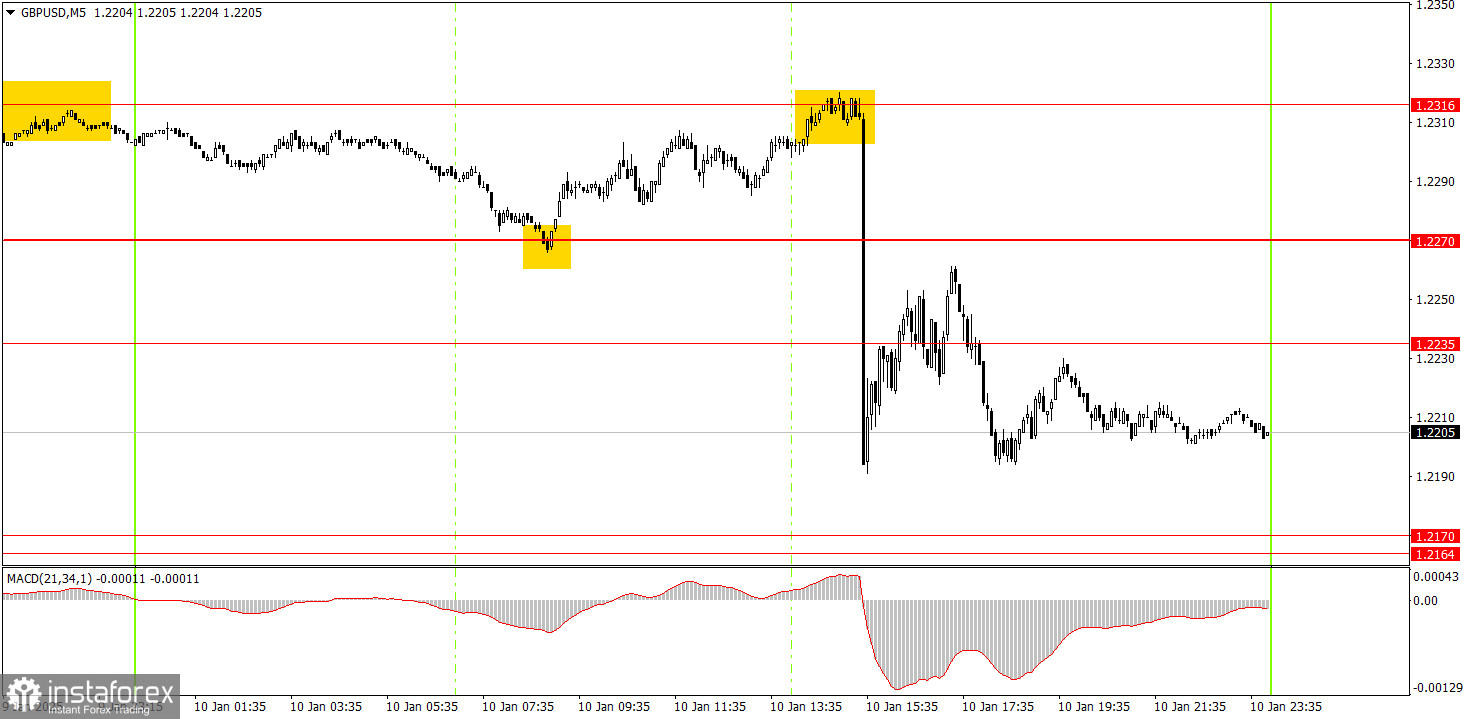
On the 5-minute timeframe, a couple of solid trading signals emerged on Friday, but executing them proved to be challenging. During the European session, a "calm" signal appeared near the 1.2270 level. By the start of the U.S. session, the pound had risen to 1.2316, where traders could take profits. However, this was followed by a sharp decline following the release of U.S. labor market and unemployment reports. Reacting to this drop or to the signal near 1.2316 was extremely difficult. Nevertheless, it is likely that traders did not end the day empty-handed.
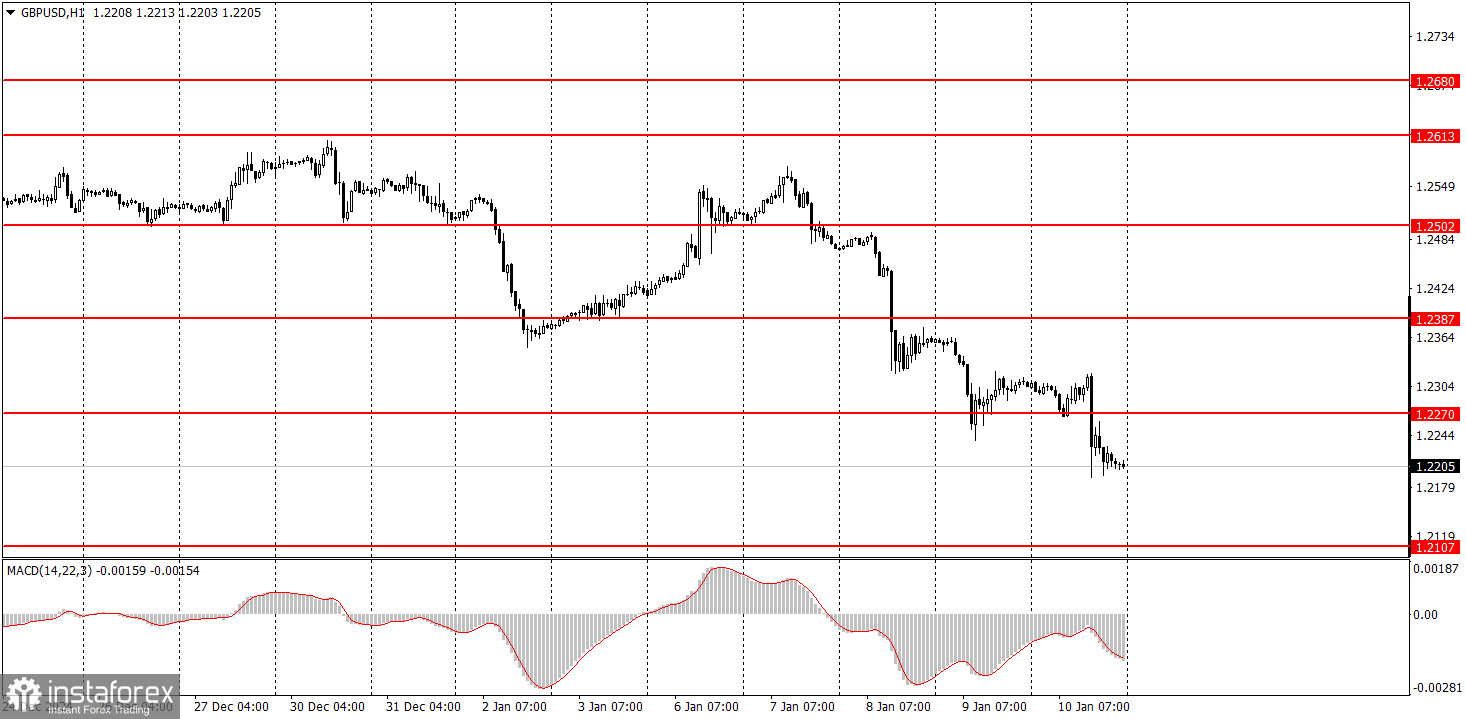
In the hourly timeframe, the GBP/USD pair has moved out of its flat range at the start of the year and has resumed its primary trend. The pound has been losing value almost every day. In the medium term, we fully anticipate a decline in the pound toward the 1.1800 level, as we believe this is the most logical outcome. Therefore, we expect further declines, but, as always, trading decisions should be based on technical signals.
On Monday, the GBP/USD pair may take a brief pause; however, another decline would not be surprising either.
On the 5-minute timeframe, the following levels are relevant for trading: 1.2089–1.2107, 1.2164–1.2170, 1.2235, 1.2270, 1.2316, 1.2372–1.2387, 1.2445, 1.2502–1.2508, 1.2547, 1.2633, 1.2680–1.2685, 1.2723, 1.2791–1.2798, and 1.2848–1.2860. No significant or even minor events are scheduled in the U.S. or the UK on Monday. However, data released on Friday has already provided enough clarity for the market to determine its approach to the GBP/USD pair.
Support and Resistance Levels: These are target levels for opening or closing positions and can also serve as points for placing Take Profit orders.
Red Lines: Channels or trendlines indicating the current trend and the preferred direction for trading.
MACD Indicator (14,22,3): A histogram and signal line used as a supplementary source of trading signals.
Important Events and Reports: Found in the economic calendar, these can heavily influence price movements. Exercise caution or exit the market during their release to avoid sharp reversals.
Forex trading beginners should remember that not every trade will be profitable. Developing a clear strategy and practicing proper money management are essential for long-term trading success.
InstaForex analytical reviews will make you fully aware of market trends! Being an InstaForex client, you are provided with a large number of free services for efficient trading.


