empty
 
 
You are about to leave
www.instaforex.eu >
a website operated by
INSTANT TRADING EU LTD
Open Account

11.02.202511:49 Forex Analysis & Reviews: How to Trade the GBP/USD Currency Pair on February 11th? Simple Tips and Trade Analysis for Beginners

This information is provided to retail and professional clients as part of marketing communication. It does not contain and should not be construed as containing investment advice or investment recommendation or an offer or solicitation to engage in any transaction or strategy in financial instruments. Past performance is not a guarantee or prediction of future performance. Instant Trading EU Ltd. makes no representation and assumes no liability as to the accuracy or completeness of the information provided, or any loss arising from any investment based on analysis, forecast or other information provided by an employee of the Company or otherwise. Full disclaimer is available here.
Monday's Trade Analysis:

1H Chart of GBP/USD

Exchange Rates 11.02.2025 analysis

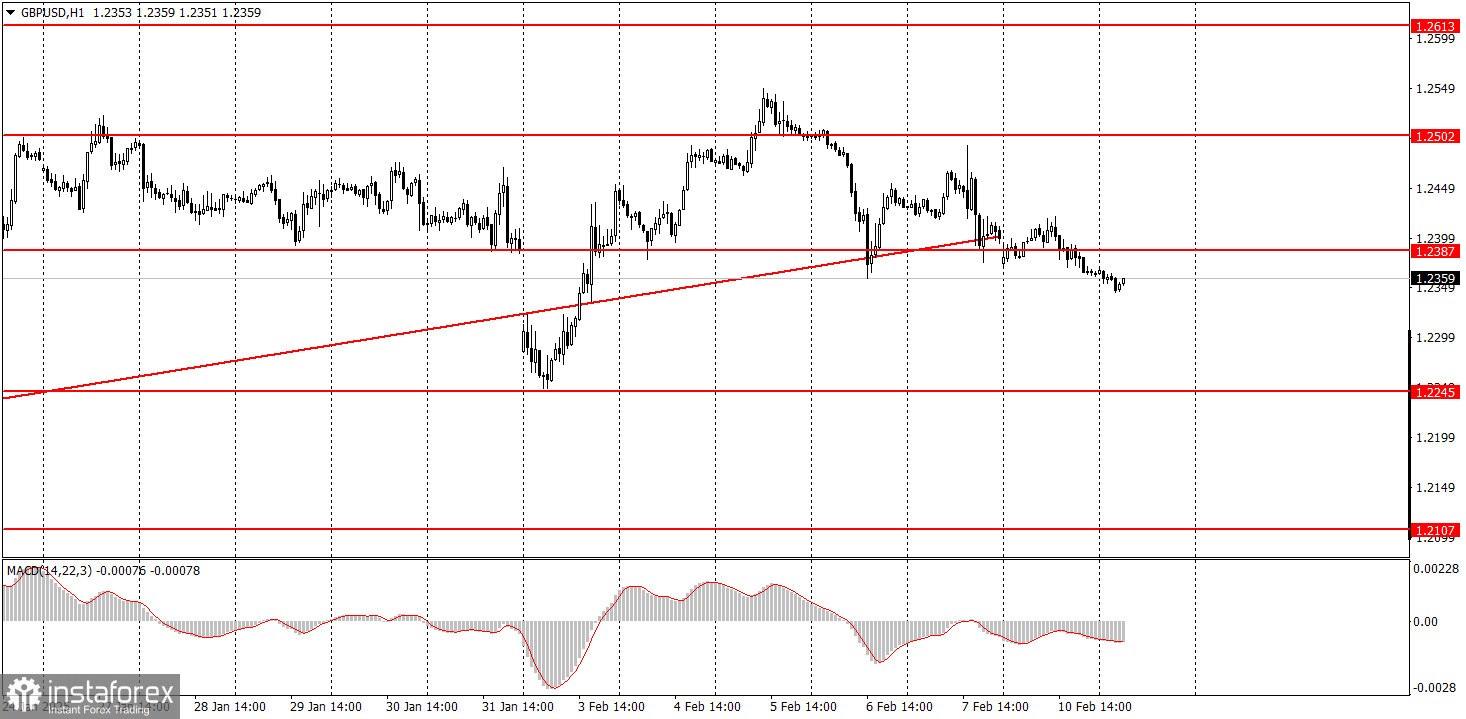
On Monday, the GBP/USD currency pair traded with low volatility and a slight downward inclination. The pair broke below the ascending trendline without much difficulty, suggesting the potential for a new short-term downtrend. However, several important events this week could support the British pound. Additionally, the current movement is still classified as corrective, which means the market could enter a choppy or sideways phase. No macro or fundamental events were recorded on Monday in either the U.S. or the U.K.

5M Chart of GBP/USD

Exchange Rates 11.02.2025 analysis

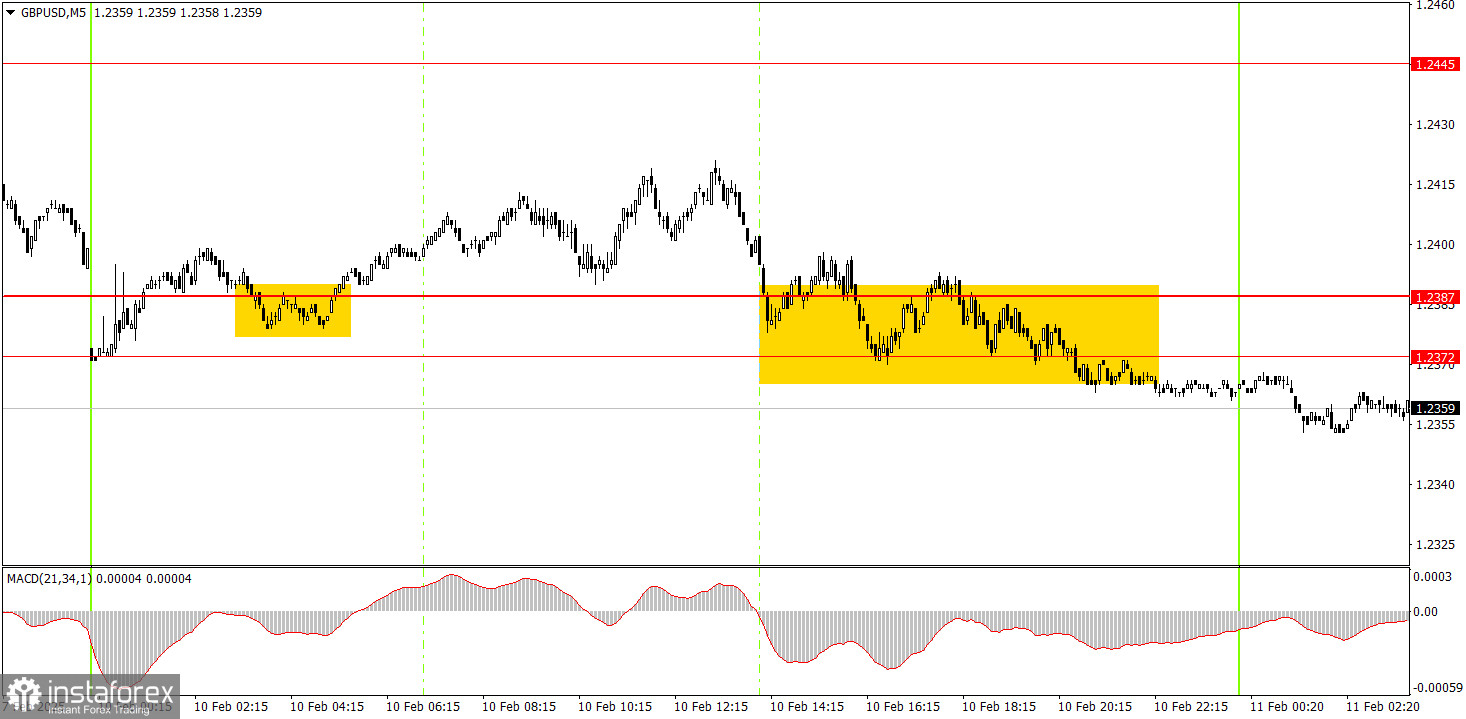
On the 5-minute timeframe, two trade signals were formed on Monday. The pair bounced off the 1.2372–1.2387 zone and moved up by about 25 points. However, it did not reach the nearest target, and the price quickly returned to its starting position, likely triggering a Stop Loss at breakeven. During the U.S. session, the pound remained within the 1.2372–1.2387 range and only broke out during the Asian session overnight. Therefore, short positions can be considered in the morning.

How to Trade on Tuesday

On the hourly timeframe, GBP/USD may enter a short-term downtrend, but the overall movement in recent weeks has been corrective on the daily timeframe. In the medium term, we fully support the pound's decline toward 1.1800, as we consider this the most logical scenario. Therefore, traders should wait for the daily timeframe correction to complete.

On Tuesday, the GBP/USD pair may continue its downward movement, as the price has broken below the ascending trendline.

On the 5-minute timeframe, key trading levels to watch are:1.2010, 1.2052, 1.2089–1.2107, 1.2164–1.2170, 1.2241–1.2270, 1.2301, 1.2372–1.2387, 1.2445, 1.2502–1.2508, 1.2547, 1.2633, 1.2680–1.2685, 1.2723, 1.2791–1.2798.

No major economic events are scheduled for Tuesday in the U.K., while in the U.S., Jerome Powell will deliver his first testimony before Congress. This is a highly significant event, as any Fed Chair speech can strongly influence market sentiment. The Fed remains the key driver of trading, rather than Donald Trump's policy moves.

Main Rules of the Trading System:

  1. The strength of a signal is measured by the time taken to form the signal (whether it is a bounce or a breakout of a level). The faster the formation, the stronger the signal.
  2. If two or more trades have been executed at the same level based on false signals, then all subsequent signals from that level should be ignored.
  3. During a flat (sideways market), currency pairs can generate multiple false signals or none at all. In such cases, it is best to stop trading once signs of a flat market appear.
  4. Trades should be opened during the European session and manually closed by the middle of the U.S. session to avoid overnight risks.
  5. On the hourly timeframe, MACD signals should only be traded if there is sufficient volatility and a confirmed trend, verified by a trendline or trend channel.
  6. If two levels are too close to each other (5–20 pips apart), they should be treated as a support or resistance zone rather than separate levels.
  7. After gaining 20 points in the right direction, move Stop Loss to breakeven to minimize risk.

Key Chart Elements:

  • Support & Resistance Levels – These are the targets for buy or sell trades. Take Profit levels can be placed near these zones.
  • Red Lines – Trend channels or trendlines, indicating the current market trend and the preferred direction for trading.
  • MACD Indicator (14,22,3) – Histogram & signal line, a secondary indicator that can also serve as a signal source.
  • Major Economic Reports & Speeches (always found in the economic calendar) can strongly influence the currency pair's movement. During these events, it is recommended to trade cautiously or exit the market to avoid sudden price reversals against the prevailing trend.

Important Note for Beginner Traders:

Not every trade will be profitable. Developing a clear trading strategy and effective money management is essential for long-term success in Forex trading.

Paolo Greco
Analytical expert of InstaForex
© 2007-2025

Open trading account

InstaForex analytical reviews will make you fully aware of market trends! Being an InstaForex client, you are provided with a large number of free services for efficient trading.


You are now leaving www.instaforex.eu, a website operated by INSTANT TRADING EU LTD
Can't speak right now?
Ask your question in the chat.
Widget callback

Turn "Do Not Track" off