 Stay
Stay 
Trading Conditions
Products
Tools


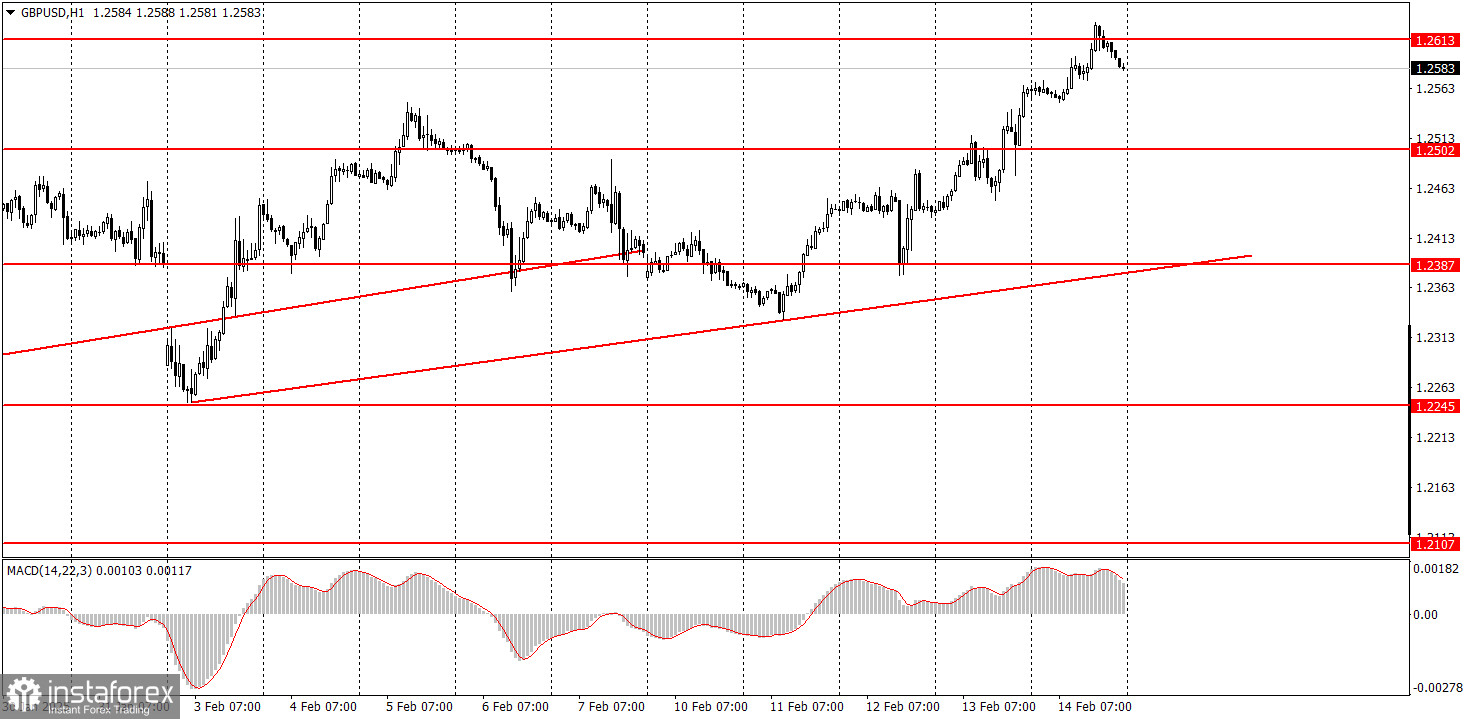
The GBP/USD pair continued its upward movement on Friday. While the euro's rise seemed illogical from a macroeconomic perspective, the pound's movement appeared even more irrational. Notably, there were no economic reports from the UK on Friday, and on Thursday, the GDP and industrial production data showed only moderately positive results relative to forecasts. A 0.1% growth in the British economy can hardly be considered a strong figure. Nevertheless, over just two days, the pound gained about 150 pips, and for the entire week, it rose by 200 pips.
The market largely ignored Powell's hawkish remarks and the critical U.S. inflation report. However, we expected this outcome, as the primary driver behind the current price action is the correction on the daily timeframe. The pair had been falling for three consecutive months, and now it needs to correct. On lower timeframes, this correction appears as a series of alternating trends, resulting in chaotic and complex movements.
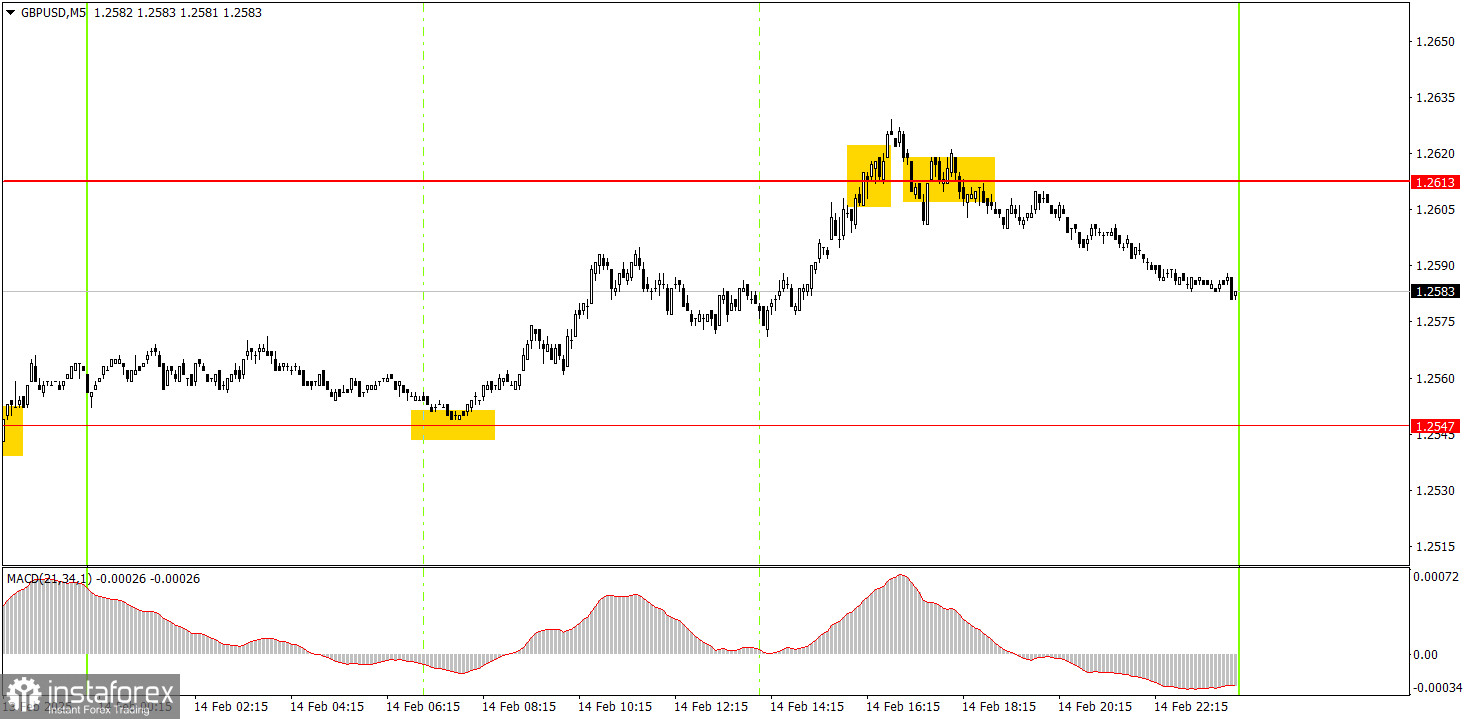
Multiple trade signals were generated on Friday in the 5-minute timeframe, offering excellent profit opportunities. At the start of the European session, the price rebounded almost perfectly from the 1.2547 level, leading to a rise towards 1.2613. Later, the price consolidated below this level, generating a sell signal, making it an ideal exit point for long positions. Total profit from these trades reached 40 pips.
On the hourly timeframe, GBP/USD may begin a short-term downtrend; however, the entire movement we have seen in recent weeks is simply a correction on the daily timeframe. In the medium term, we anticipate a further decline in the pound towards 1.1800, as we believe this is the most logical scenario. The key now is to wait for the upward correction on the daily timeframe to conclude.
On Monday, GBP/USD could potentially start a new downward movement, considering the high level of market uncertainty. The price rose irrationally throughout last week, but the short-term upward momentum remains intact.
On the 5-minute timeframe, key trading levels are 1.2010, 1.2052, 1.2089-1.2107, 1.2164-1.2170, 1.2241-1.2270, 1.2301, 1.2372-1.2387, 1.2445, 1.2502-1.2508, 1.2547, 1.2633, 1.2680-1.2685, 1.2723, 1.2791-1.2798. There are no significant events scheduled for Monday in either the UK or the US, so market movements may be weak.
Support and Resistance Levels: These are target levels for opening or closing positions and can also serve as points for placing Take Profit orders.
Red Lines: Channels or trendlines indicating the current trend and the preferred direction for trading.
MACD Indicator (14,22,3): A histogram and signal line used as a supplementary source of trading signals.
Important Events and Reports: Found in the economic calendar, these can heavily influence price movements. Exercise caution or exit the market during their release to avoid sharp reversals.
Forex trading beginners should remember that not every trade will be profitable. Developing a clear strategy and practicing proper money management are essential for long-term trading success.
InstaForex analytical reviews will make you fully aware of market trends! Being an InstaForex client, you are provided with a large number of free services for efficient trading.


