 Stay
Stay 
Trading Conditions
Products
Tools


The EUR/USD currency pair experienced a slight downward retracement on Monday after five consecutive days of growth. Despite this, volatility remained extremely low, with no significant fundamental or macroeconomic factors influencing the market. Consequently, there were no noteworthy developments in the financial markets or on a global scale.
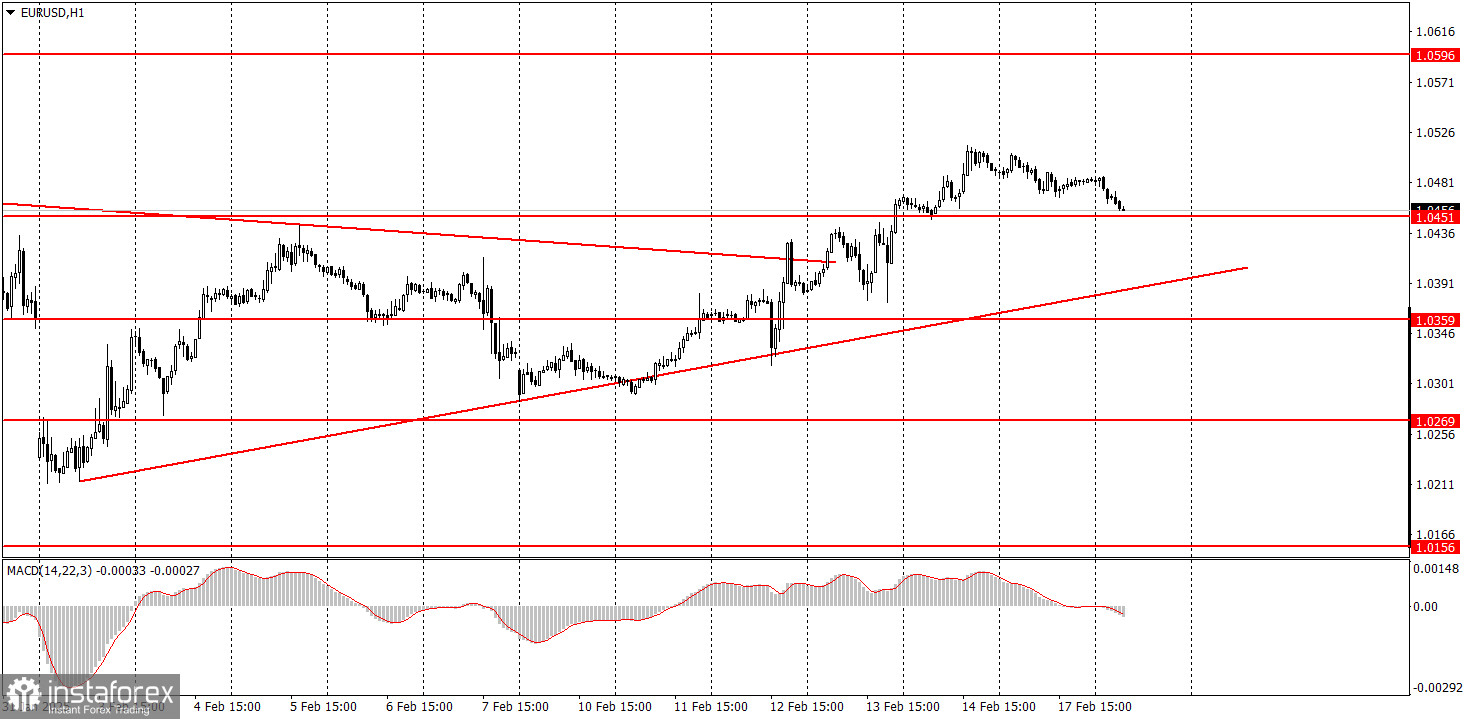
The local uptrend in the euro persists, as indicated by the ascending trendline. However, it is important to recognize that the alternating trends observed on the hourly timeframe are part of a larger upward correction on the daily timeframe, which could continue for several more months. While predicting the exact end of this correction is quite challenging, traders should be prepared for the eventual resumption of the global downtrend.
Currently, the euro lacks a solid fundamental basis for sustained medium-term growth. Its recent rally appears to be nothing more than a technical correction driven by market dynamics.
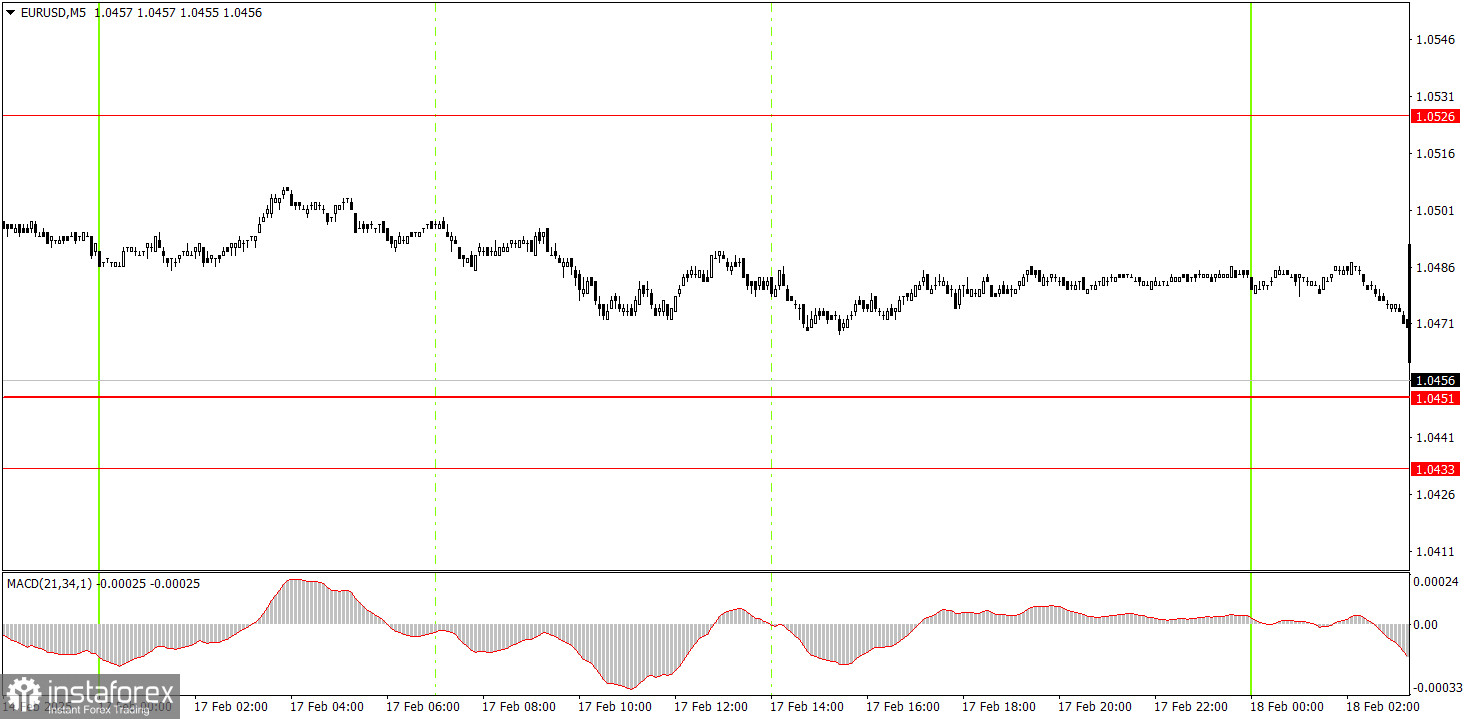
No trading signals were formed on Monday in the 5-minute timeframe. The price remained sideways for most of the day and did not approach any key levels. Given such low volatility, it would not have been advisable for novice traders to enter the market.
On the hourly timeframe, the EUR/USD pair is currently within a medium-term downtrend while also showing signs of a local uptrend. As previously stated, we expect the euro to decline, as the fundamental and macroeconomic conditions continue to favor the U.S. dollar significantly more than the euro. However, the ongoing upward correction on the daily timeframe may persist for several more weeks. On the hourly chart, we might witness additional short-term trends before the primary downtrend resumes.
On Tuesday, price movements are likely to be erratic, illogical, and weak. The market is inclined to rise due to the need for a correction on the daily timeframe, but pullbacks and downward reversals remain possible.
On the 5-minute timeframe, key levels to consider are 1.0156, 1.0221, 1.0269-1.0277, 1.0334-1.0359, 1.0433-1.0451, 1.0526, 1.0596, 1.0678, 1.0726-1.0733, 1.0797-1.0804, and 1.0845-1.0851. On Tuesday, the ZEW Economic Sentiment indices will be released in the Eurozone, but they are unlikely to generate significant interest among traders. In the U.S., there are no major economic data releases scheduled, suggesting another session of subdued price action.
Support and Resistance Levels: These are target levels for opening or closing positions and can also serve as points for placing Take Profit orders.
Red Lines: Channels or trendlines indicating the current trend and the preferred direction for trading.
MACD Indicator (14,22,3): A histogram and signal line used as a supplementary source of trading signals.
Important Events and Reports: Found in the economic calendar, these can heavily influence price movements. Exercise caution or exit the market during their release to avoid sharp reversals.
Forex trading beginners should remember that not every trade will be profitable. Developing a clear strategy and practicing proper money management are essential for long-term trading success.
InstaForex analytical reviews will make you fully aware of market trends! Being an InstaForex client, you are provided with a large number of free services for efficient trading.


