 Stay
Stay 
Trading Conditions
Products
Tools


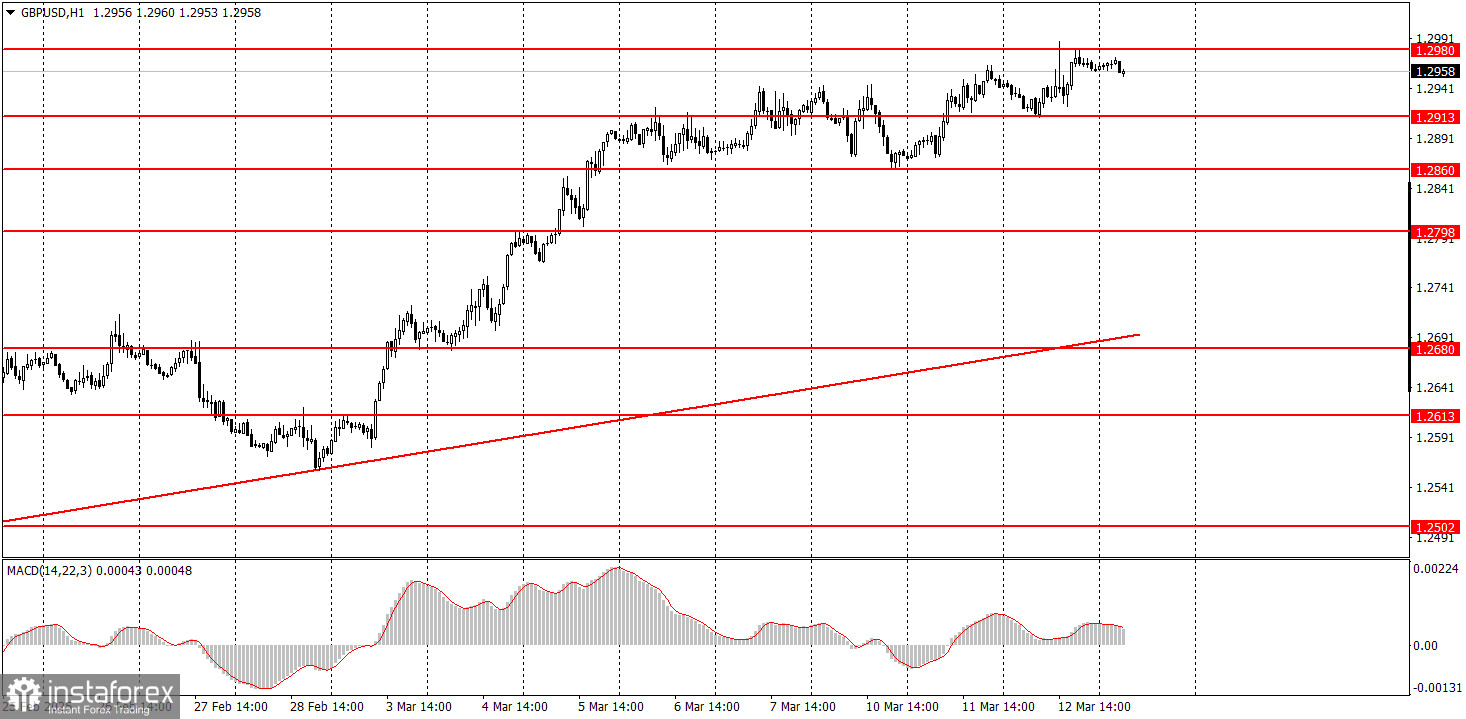
On Wednesday, the GBP/USD pair continued its upward movement. The U.S. inflation report should have caused at least a slight drop in the dollar, especially since the dollar has been falling for the past two months for various reasons. Locally, we observed the anticipated market reaction to the lower U.S. inflation, as this could prompt the Federal Reserve to adopt a more dovish stance. However, the euro did not experience any growth, and the market continues to overlook all bearish factors. As a result, 90% of the pound's rise is mainly attributed to one theme—Trump's tariffs. The upward movement is slowing down, and the entire pound rally appears to be merely a correction on the daily timeframe. After such a significant rise, it's now challenging to determine if the main downtrend will resume.
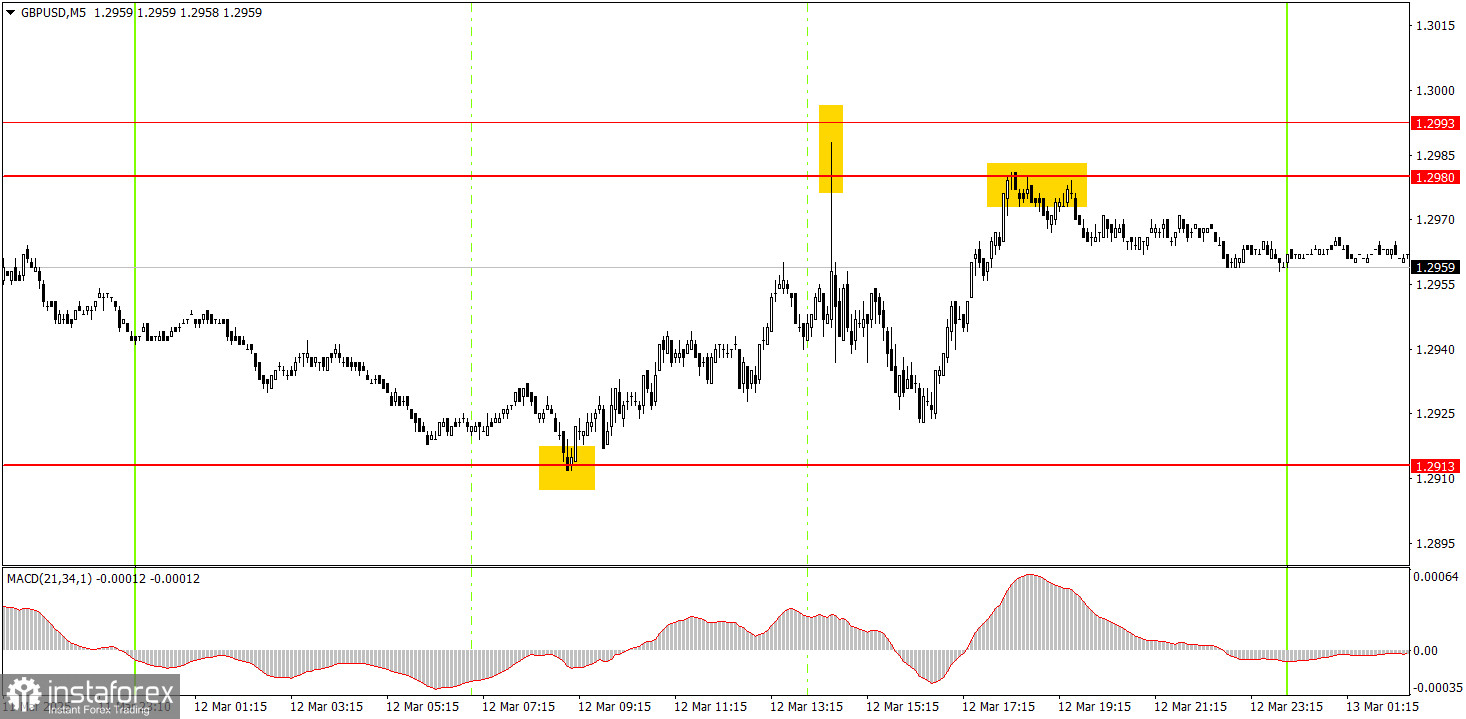
On the 5-minute timeframe on Wednesday, three trading signals were generated. During the European session, the price rebounded precisely from the 1.2913 level and reached the 1.2980-1.2993 area at the start of the U.S. session. This indicates that novice traders likely had the opportunity to close long positions, but opening short positions was unlikely. The price tested the 1.2880 level during the release of the U.S. inflation report, resulting in rapid price movement. In the evening, the price rebounded again from 1.2980, providing traders with another chance to open short positions.
The GBP/USD pair should have already started a short-term downtrend on the hourly timeframe, but Trump is doing everything to prevent it. We still expect the pound to fall to 1.1800 in the medium term, but it is unclear how long the dollar will continue collapsing due to Trump's actions. When this movement ends, the technical picture on all timeframes may change drastically.
On Thursday, the GBP/USD pair could continue rising if Trump keeps causing chaos and dictating his terms to the world. A downward correction is overdue, but the market only focuses on selling the dollar. Momentum-driven movement to the upside may continue.
On the 5-minute timeframe, trading can be done using levels: 1.2301, 1.2372-1.2387, 1.2445, 1.2502-1.2508, 1.2547, 1.2613, 1.2680-1.2685, 1.2723, 1.2791-1.2798, 1.2848-1.2860, 1.2913, 1.2980-1.2993, 1.3043, 1.3102-1.3107. No significant events are scheduled in the UK on Thursday, while the U.S. will release reports on producer prices and jobless claims—both of which are secondary data.
Support and Resistance Levels: These are target levels for opening or closing positions and can also serve as points for placing Take Profit orders.
Red Lines: Channels or trendlines indicating the current trend and the preferred direction for trading.
MACD Indicator (14,22,3): A histogram and signal line used as a supplementary source of trading signals.
Important Events and Reports: Found in the economic calendar, these can heavily influence price movements. Exercise caution or exit the market during their release to avoid sharp reversals.
Forex trading beginners should remember that not every trade will be profitable. Developing a clear strategy and practicing proper money management are essential for long-term trading success.
InstaForex analytical reviews will make you fully aware of market trends! Being an InstaForex client, you are provided with a large number of free services for efficient trading.


