 Stay
Stay 
Trading Conditions
Products
Tools


The GBP/USD pair also showed a downward movement on Wednesday, for which there were no valid reasons. There were no noteworthy events in the UK yesterday, while the U.S. released its Q1 GDP and ADP labor market reports. It's easy to guess that both U.S. reports were complete failures — dramatic ones. It was revealed that under Trump's leadership, the U.S. economy contracted by 0.3% in the first quarter, much worse than even the most pessimistic forecasts. Private sector employment grew by only 62,000, while experts had forecast an increase of 115,000, and the previous month saw growth of 147,000. The pair's downward movement therefore implies U.S. dollar strengthening. As such, yesterday's price movement was in no way linked to macroeconomic statistics.
5M chart of the GBP/USD pair.
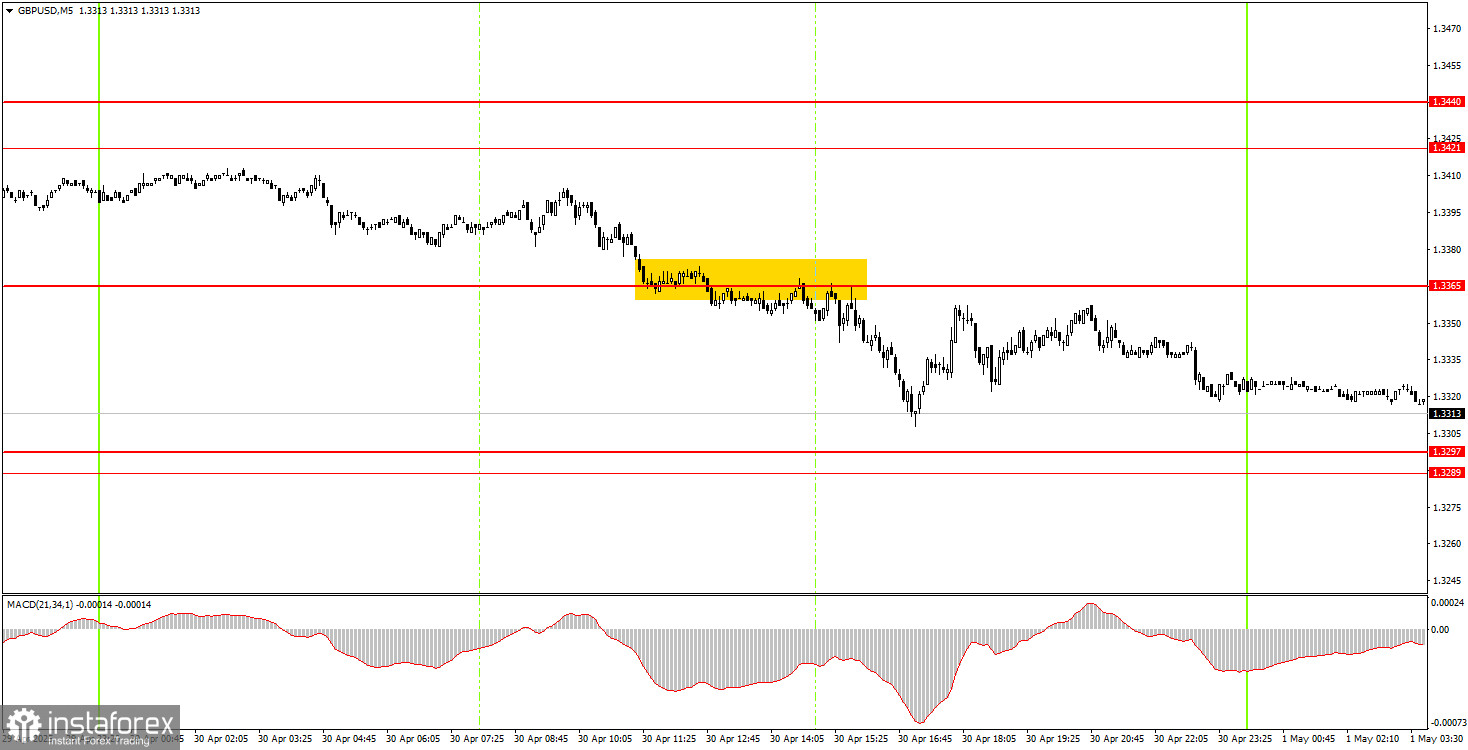
In the 5-minute time frame on Wednesday, only one trading signal was formed. At the junction of the European and U.S. sessions, the pair broke through the 1.3365 level, then continued its decline and by Thursday morning had tested the 1.3297 level. Further dollar strength looks highly questionable, so it's possible that the pair may begin rising today. Yesterday's trade could have yielded around 20–25 points, given that volatility remains low.
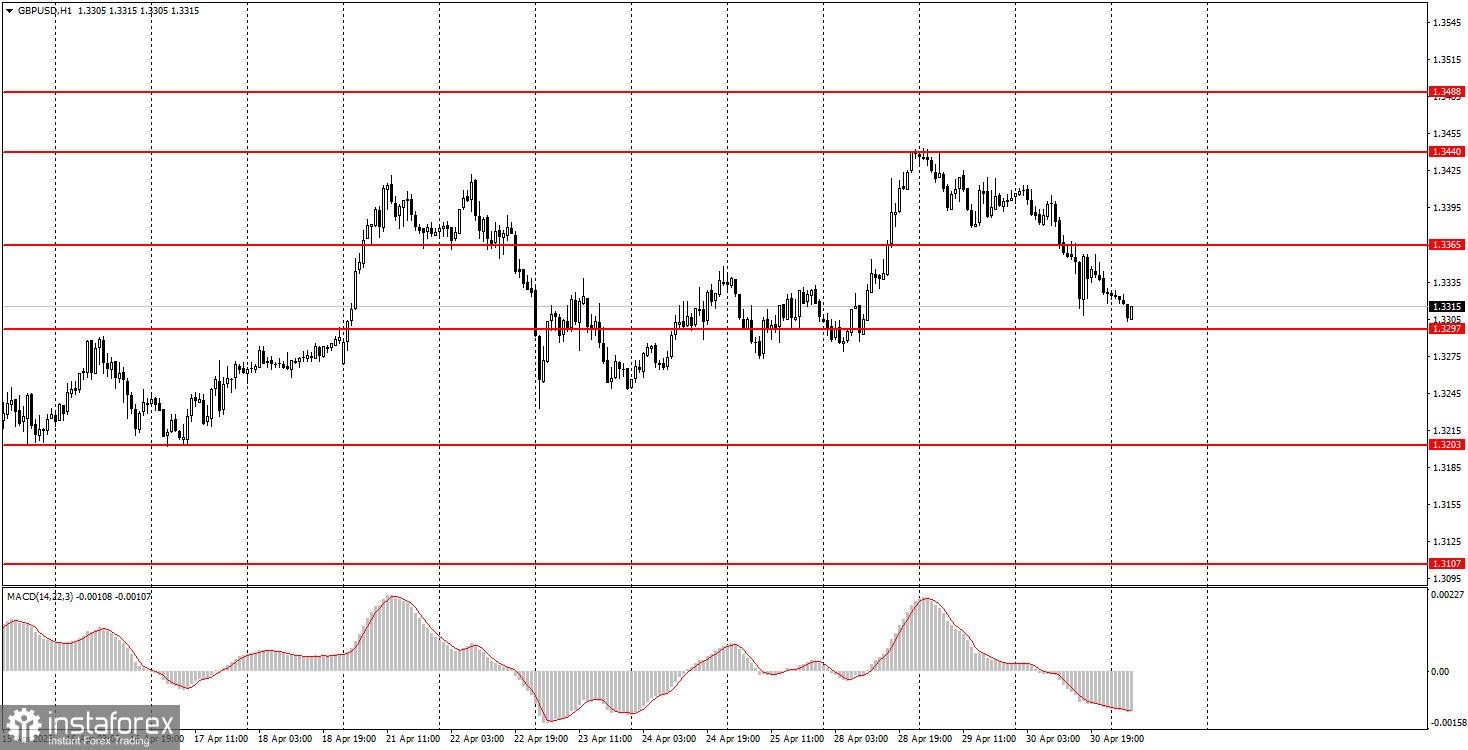
How to Trade on Thursday: In the hourly time frame, the GBP/USD pair could have started a downtrend long ago, but the market continues to focus solely on Trump. As a result, the pound continues to steadily climb. Thus, the pair's future movements depend only on the U.S. president and his decisions, and on nothing else. Perhaps in the future the market's attitude toward news will change, but for now, we see no sign of that.
On Thursday, the GBP/USD pair could begin a new upward phase. Yesterday, U.S. statistics disappointed, and there's no reason to expect that Thursday's and Friday's data will support the U.S. dollar. However, the market might just ignore them altogether.
On the 5-minute time frame, you can currently trade based on the levels: 1.2848–1.2860, 1.2913, 1.2980–1.2993, 1.3043, 1.3102–1.3107, 1.3145–1.3167, 1.3203, 1.3289–1.3297, 1.3365, 1.3421–1.3440, 1.3488, 1.3537, 1.3580–1.3598. There are no important events scheduled in the UK for Thursday, while the U.S. will publish the ISM Manufacturing PMI. U.S. data remains a new headache for the dollar — but let's remember, the market is currently paying no attention to it. Formally, the dollar could even continue rising despite poor data from overseas.
Basic Rules of the Trading System:
What's on the charts: Price support and resistance levels – levels that serve as targets when opening buy or sell positions. Take Profit levels can be placed near them.
Red lines – channels or trendlines showing the current trend and suggesting which direction is preferable for trading.
MACD Indicator (14,22,3) – histogram and signal line – a supplementary indicator that can also be used as a signal source.
Important speeches and reports (always listed in the news calendar) can significantly influence the movement of a currency pair. Therefore, during their release, it is recommended to trade with maximum caution or exit the market to avoid sharp price reversals against the prior direction.
Beginner Forex traders should remember that not every trade will be profitable. Developing a clear strategy and sound money management is the key to long-term success in trading.
InstaForex analytical reviews will make you fully aware of market trends! Being an InstaForex client, you are provided with a large number of free services for efficient trading.


