 Stay
Stay 
Trading Conditions
Products
Tools


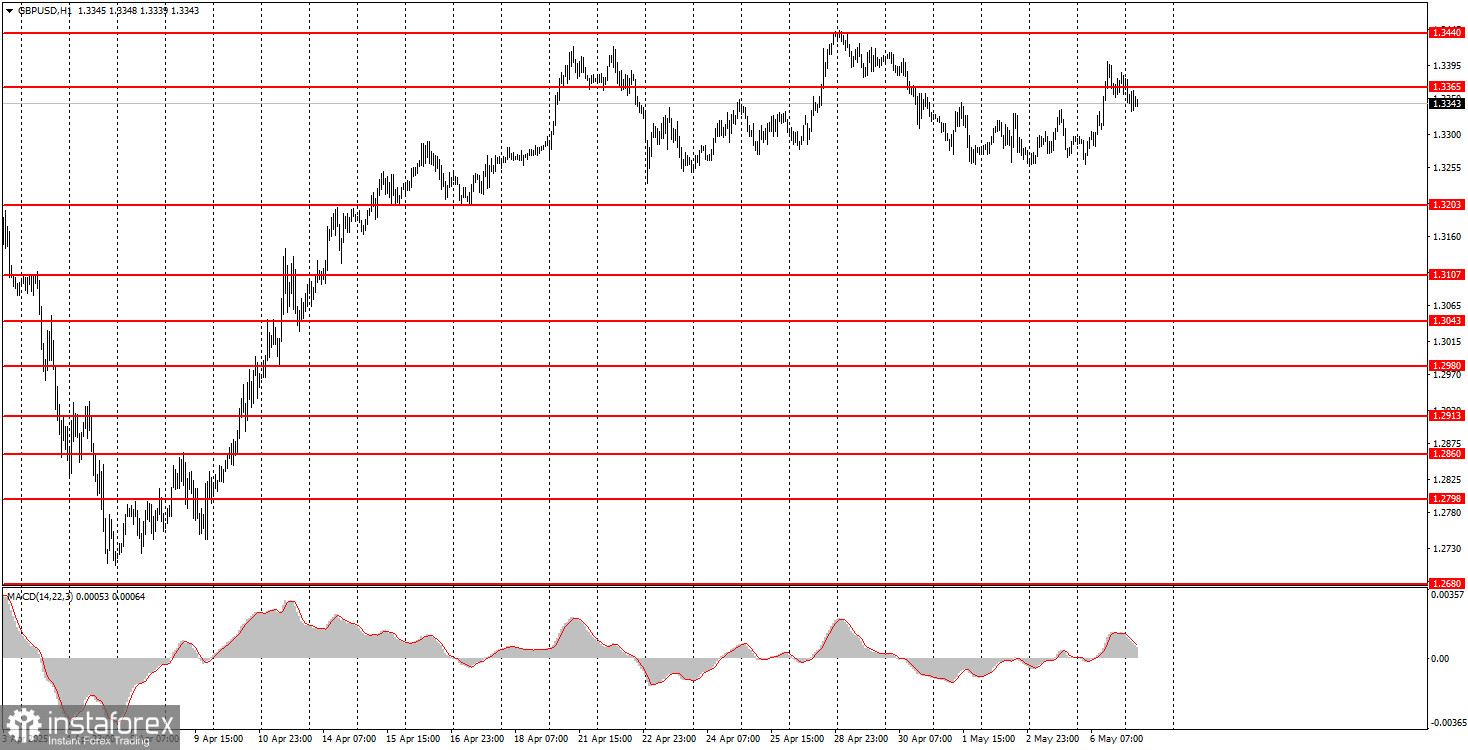
The GBP/USD pair exhibited a notable upward movement on Tuesday, although it remains within a sideways channel that may not be immediately apparent to all traders. However, on the 1-hour timeframe with a reduced scale, it's visible that the price has been trading between 1.3203 and 1.3440 since April 16. Yes, it's a wide channel, but still a range-bound market. Thus, yesterday we saw another upward swing of the British currency, for which there were no real reasons, and none were needed, as in a sideways market, price tends to move erratically in both directions. We have the Federal Reserve meeting this evening, and the Bank of England will meet tomorrow. Theoretically, the British pound should react nervously, since the BoE is almost certain to cut the key rate, while the Fed likely will not. However, we must again point out that even central bank meetings currently have limited influence on traders' decisions.
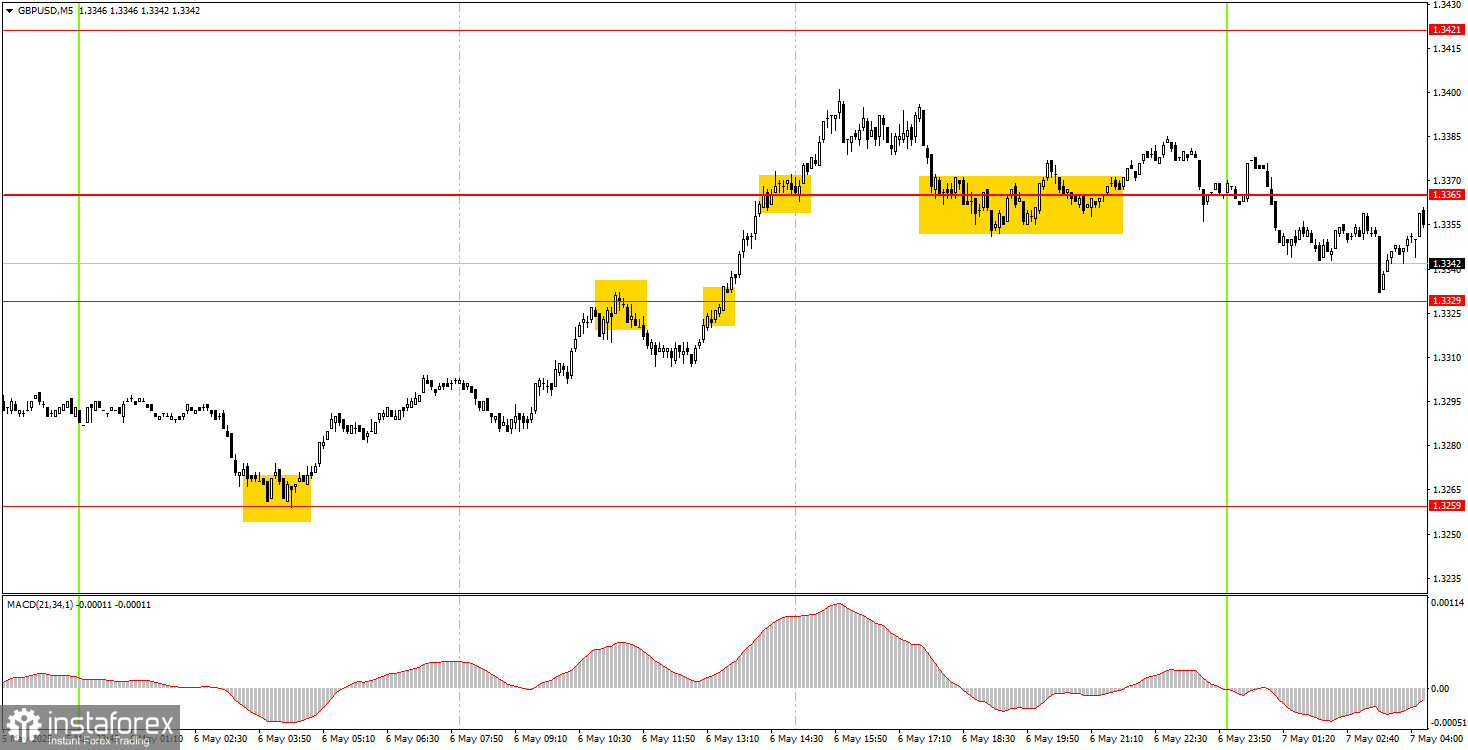
On Tuesday's 5-minute timeframe, several good trading signals were generated, as the price moved largely in one direction throughout the day. The first buy signal—perfect in terms of accuracy—was formed overnight near the 1.3259 level. This was followed by a false sell signal near 1.3329 and then a valid buy signal around the same level. The upward move ended above 1.3365, so traders ended up with two profitable trades and one loss.
On the hourly chart, GBP/USD continues to follow Donald Trump's influence, with the pound steadily creeping higher or maintaining high levels. Therefore, the pair's movements still depend solely on the U.S. president and his decisions. Perhaps the market's attitude toward news will shift in the future, but that's not the case right now.
On Wednesday, GBP/USD may move in either direction. Even the upcoming Fed and BoE meetings have failed to generate logical or consistent movement in the pair. We saw growth yesterday, but today we may see a decline even before the Fed meeting.
On the 5-minute chart, the relevant trading levels for Wednesday are: 1.2848–1.2860, 1.2913, 1.2980–1.2993, 1.3043, 1.3102–1.3107, 1.3145–1.3167, 1.3203, 1.3259, 1.3329, 1.3365, 1.3421–1.3440, 1.3488, 1.3537, 1.3580–1.3598. No significant events are scheduled for Wednesday in the UK, while in the U.S., the Fed's meeting results will be announced. Although this is an important event, there are serious doubts that the market will respond decisively—or that the Fed's tone will shift.
Support and Resistance Levels: These are target levels for opening or closing positions and can also serve as points for placing Take Profit orders.
Red Lines: Channels or trendlines indicating the current trend and the preferred direction for trading.
MACD Indicator (14,22,3): A histogram and signal line used as a supplementary source of trading signals.
Important Events and Reports: Found in the economic calendar, these can heavily influence price movements. Exercise caution or exit the market during their release to avoid sharp reversals.
Forex trading beginners should remember that not every trade will be profitable. Developing a clear strategy and practicing proper money management are essential for long-term trading success.
InstaForex analytical reviews will make you fully aware of market trends! Being an InstaForex client, you are provided with a large number of free services for efficient trading.


