 Stay
Stay 
Trading Conditions
Products
Tools


In my morning forecast, I focused on the 1.1566 level and planned to make trading decisions based on it. Let's take a look at the 5-minute chart and analyze what happened there. There was an upward movement and a breakout, but a retest never occurred, so I ended up without any trades. The technical picture was revised for the second half of the day.
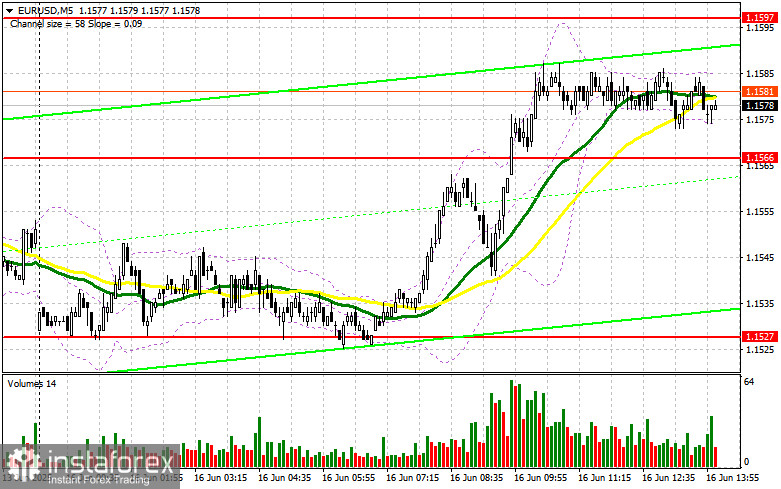
Data showing a decline in inflation in Italy supported the euro in the first half of the day, as the ECB now has fewer reasons to ease monetary policy. In the second half, we only await figures for the Empire Manufacturing Index, giving the US dollar little room for growth. Only very strong data would revive pressure on the EUR/USD pair.
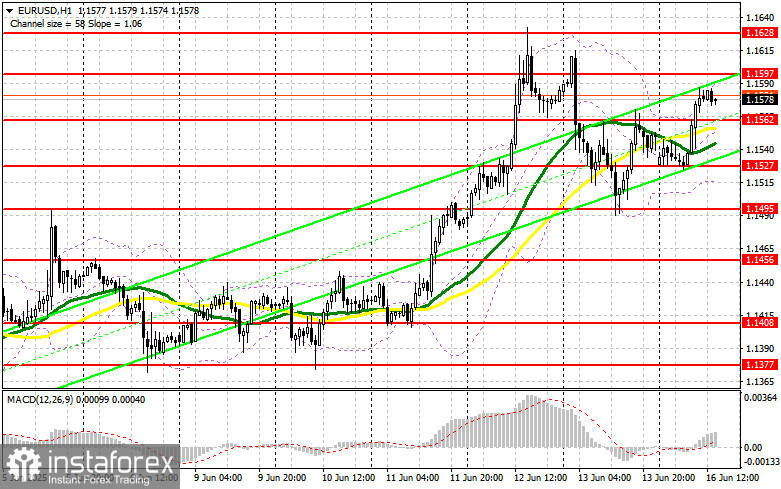
If the euro declines, I will act around the new support at 1.1562. A false breakout there will be a signal to buy EUR/USD in anticipation of a continuation of the bullish trend and a move toward the resistance at 1.1597. A breakout and retest of this range from above will confirm the entry point, targeting the 1.1628 level — the monthly high. The ultimate target will be 1.1674, where I plan to take profit.
If EUR/USD declines and there is no activity around 1.1562, pressure on the pair will increase, potentially dragging it down to 1.1527. I will only consider buying after a false breakout at this level. Otherwise, I plan to open long positions on a rebound from 1.1495, aiming for an intraday correction of 30–35 points.
Sellers were absent in the first half of the day, so as tensions in the Middle East subside, large players may adopt a wait-and-see approach. In the event of another upward spike, only a false breakout near 1.1597 will signal short positions, targeting the 1.1562 support. A breakout and consolidation below this range would be a good sell setup, with a move toward 1.1527, where the moving averages are aligned in support of the bulls. The final target will be 1.1495, where I plan to take profit.
If EUR/USD continues to rise in the second half of the day and sellers fail to act near 1.1597, buyers may push the pair toward 1.1628. I will consider selling only after an unsuccessful consolidation above that level. Otherwise, I plan to sell on a rebound from 1.1674, targeting a 30–35 point downward correction.
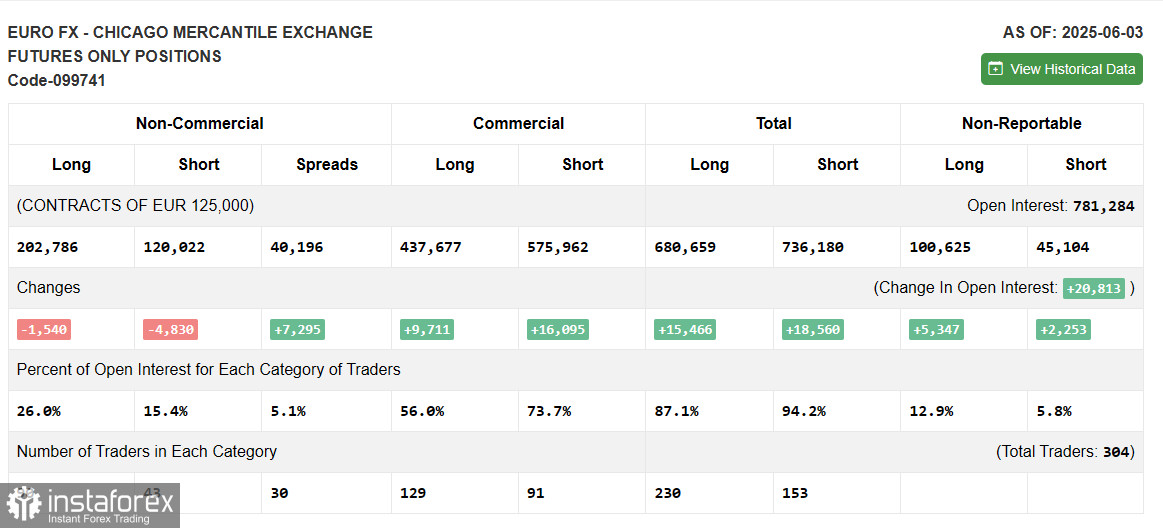
COT Report (Commitments of Traders) – June 3:
There was a reduction in both long and short positions. The ECB's decision to cut interest rates was expected and did not shift the balance of power in the market. Expectations that the regulator will pause the easing cycle only strengthened the euro's position. A solid eurozone GDP report also supports further euro growth, which explains the larger decrease in short positions compared to long ones.
According to the COT report, long non-commercial positions dropped by 1,540 to 202,786, while short non-commercial positions fell by 4,830 to 120,022. As a result, the gap between long and short positions widened by 7,295.
Indicator Signals:
Moving Averages:
Trading is occurring above the 30- and 50-day moving averages, indicating further potential for growth in the pair.
Note: The author considers the moving averages on the H1 chart, which may differ from the classical daily moving averages on the D1 chart.
Bollinger Bands:
In case of a decline, the lower band near 1.1525 will act as support.
Indicator Descriptions:
InstaForex analytical reviews will make you fully aware of market trends! Being an InstaForex client, you are provided with a large number of free services for efficient trading.


