 Stay
Stay 
Trading Conditions
Products
Tools


On Tuesday, the GBP/USD pair also showed a relatively strong decline in the second half of the day, which could only be attributed to factors that were impossible to predict in advance. We believe the dollar strengthened due to the potential U.S. strike on Iran, which Trump has strongly hinted at over the past few days, or as an "advance reaction" to the upcoming Federal Reserve meeting. Let us recall that Washington demanded Iran sign a "nuclear deal," under which Tehran was expected to abandon any nuclear development, even for peaceful purposes. Tehran refused these terms. Trump insists that Iran must not possess nuclear weapons and is, therefore, ready to strike the country. This is yet another escalation in the Middle East conflict; in the short term, the dollar may have received some support.
As for the Fed meeting, it's extremely difficult to expect meaningful support for the dollar from the U.S. central bank right now. Hence, we also don't rule out the possibility that what we saw yesterday was a technical rally and that today, the market might actively sell the dollar at more favorable prices.
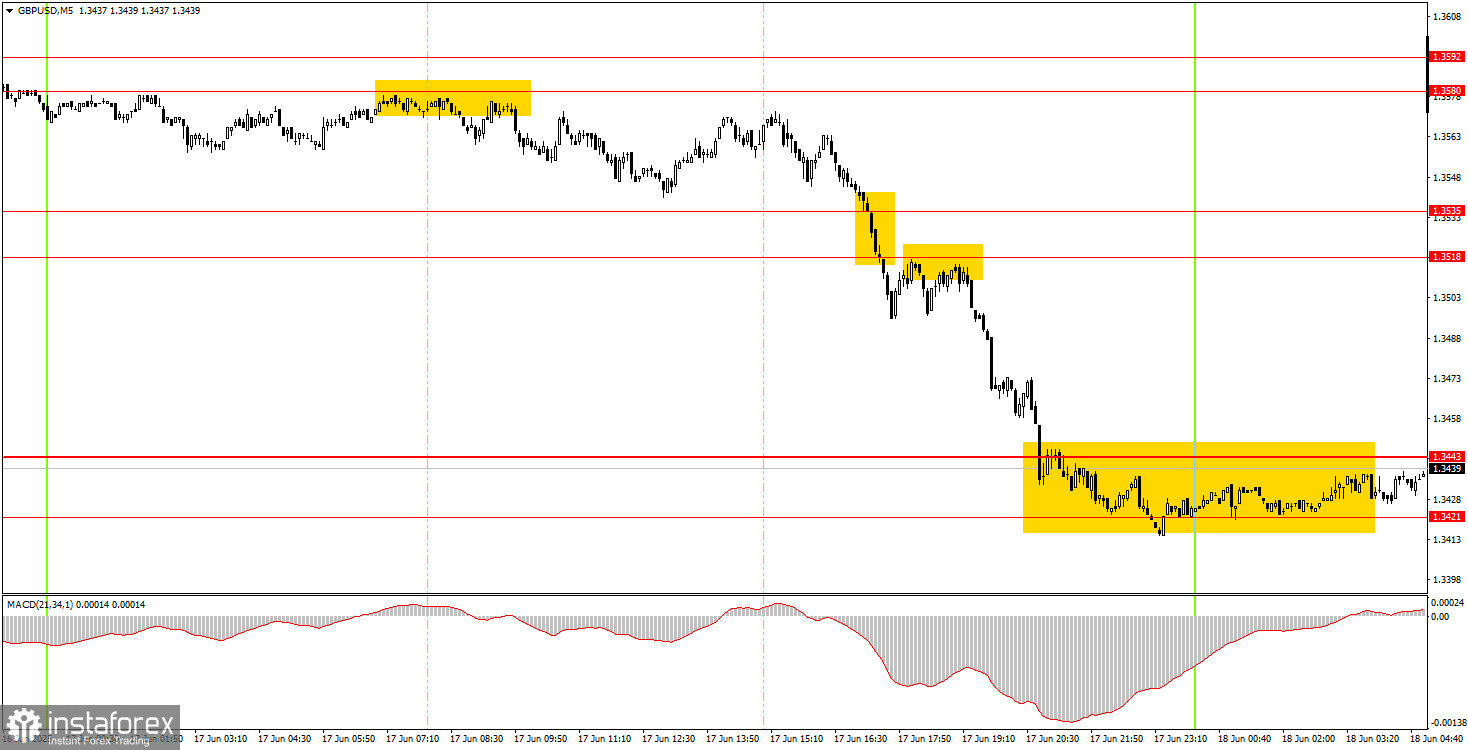
On the 5-minute timeframe on Tuesday, a great sell signal was formed right at the start of the European trading session. The price bounced thrice from the 1.3580–1.3592 area, after which the pair stayed in a downward trajectory the rest of the day, forming only additional sell signals. By the end of the session, the pair reached the 1.3421–1.3443 area, where profits on the only short position could be secured. The profit amounted to at least 130–140 pips.
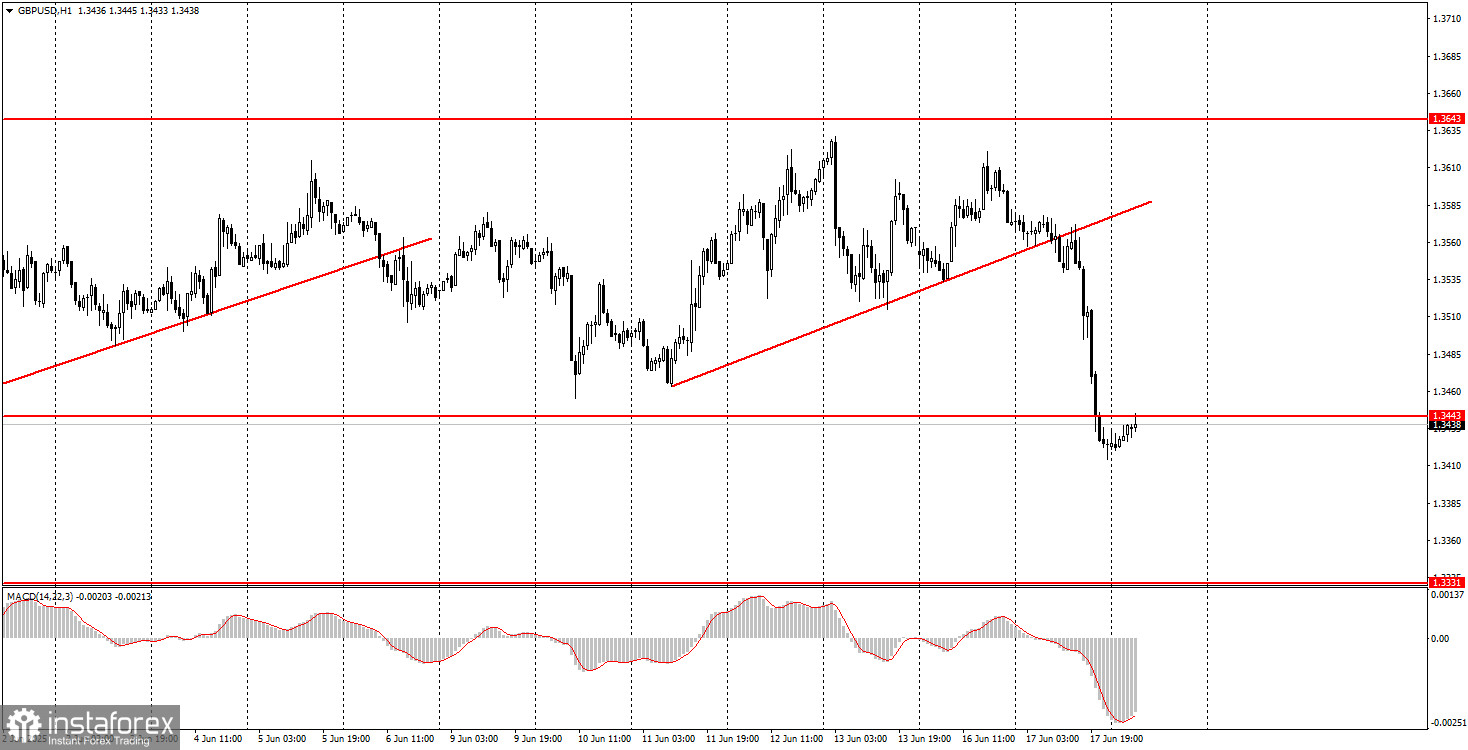
On the hourly timeframe, the GBP/USD pair continues to respond mainly to Donald Trump's policies and still views them with great skepticism. As before, the market uses any opportunity to sell the dollar rather than buy it. This will likely continue until the market sees clear signs of the trade war ending and until Trump stops making unauthorized decisions. Occasionally, the dollar will show growth since it can't decline indefinitely every single day, but such occurrences remain rare for now.
On Wednesday, the GBP/USD pair may again show high volatility, as two potentially significant events are on the calendar today:
In the 5-minute timeframe, trading can be conducted around the following levels: 1.3043, 1.3102–1.3107, 1.3203–1.3211, 1.3259, 1.3329–1.3331, 1.3421–1.3443, 1.3518–1.3535, 1.3580–1.3592, 1.3643–1.3652, 1.3695, 1.3740. The UK inflation report for May will also be published on Wednesday, making it the third major event of the day. Everything points toward a "stormy" day in the markets.
Support and Resistance Levels: These are target levels for opening or closing positions and can also serve as points for placing Take Profit orders.
Red Lines: Channels or trendlines indicating the current trend and the preferred direction for trading.
MACD Indicator (14,22,3): A histogram and signal line used as a supplementary source of trading signals.
Important Events and Reports: Found in the economic calendar, these can heavily influence price movements. Exercise caution or exit the market during their release to avoid sharp reversals.
InstaForex analytical reviews will make you fully aware of market trends! Being an InstaForex client, you are provided with a large number of free services for efficient trading.


