 Stay
Stay 
Trading Conditions
Products
Tools


On Wednesday, the GBP/USD pair spent most of the day in a minimal upward movement, clearly awaiting the outcome of the Federal Reserve meeting. The results of the U.S. central bank's latest meeting surprised no one. The U.S. dollar rose slightly, but the total increase by Thursday morning was only 65 pips. A day earlier, after news emerged of the possible U.S. entry into the war against Iran, the dollar had strengthened significantly. Returning to the Fed: no notable decisions were made, and no bold forecasts or statements were issued. As for the dot plot, it showed a somewhat more hawkish stance from the central bank. Now, 7 out of 19 members expect the key rate to remain unchanged throughout 2025. Thus, the U.S. dollar had grounds for a modest rise, but we do not believe the market is reversing its trend, nor that Donald Trump's policies will stop having a negative impact on the dollar's exchange rate.
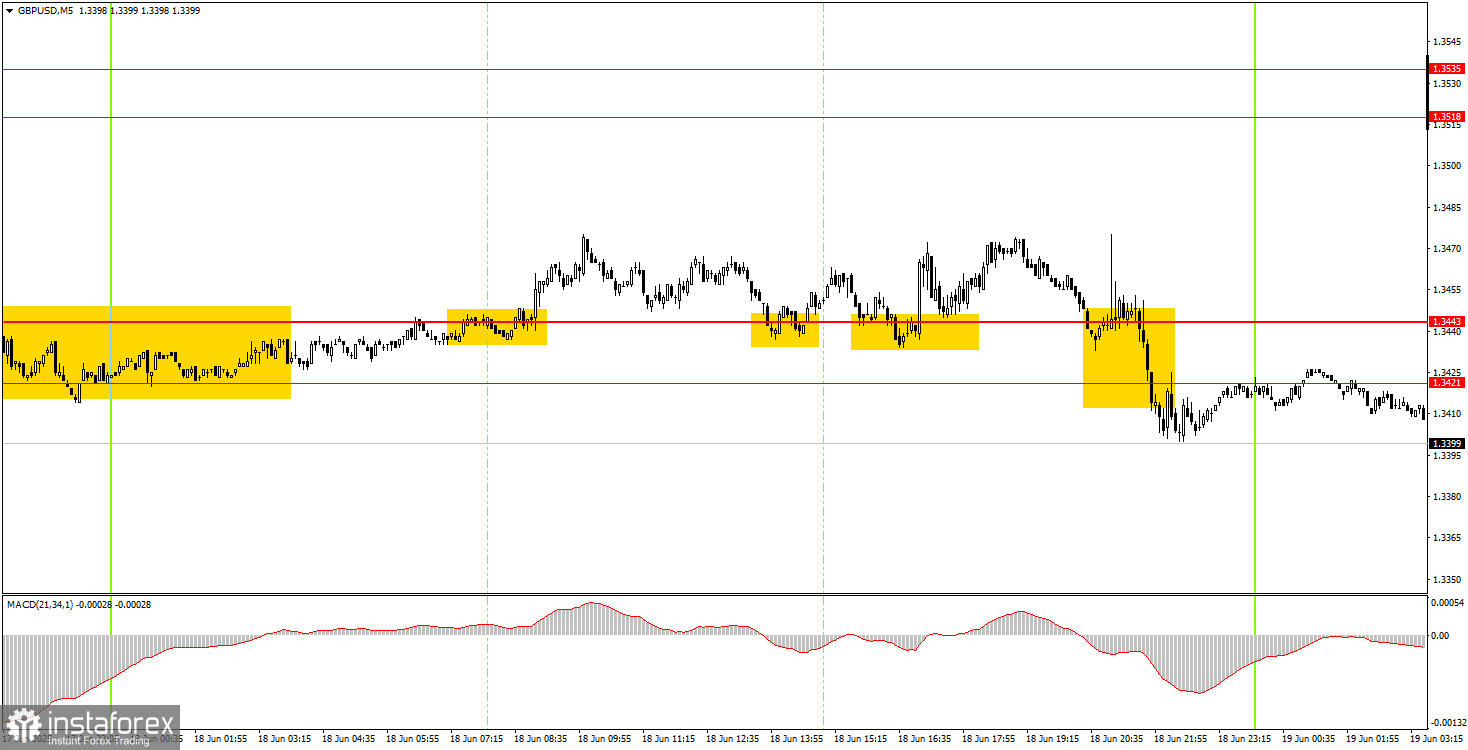
On the 5-minute timeframe, the pair remained flat all day Wednesday. The price rebounded three times from the 1.3443 level within this sideways range. In each case, the pair failed to move even 25 pips in the desired direction. The signals essentially duplicated each other, and there was no real movement. Before the Fed's announcement, it was advisable to exit the market, as trader reactions were unpredictable.
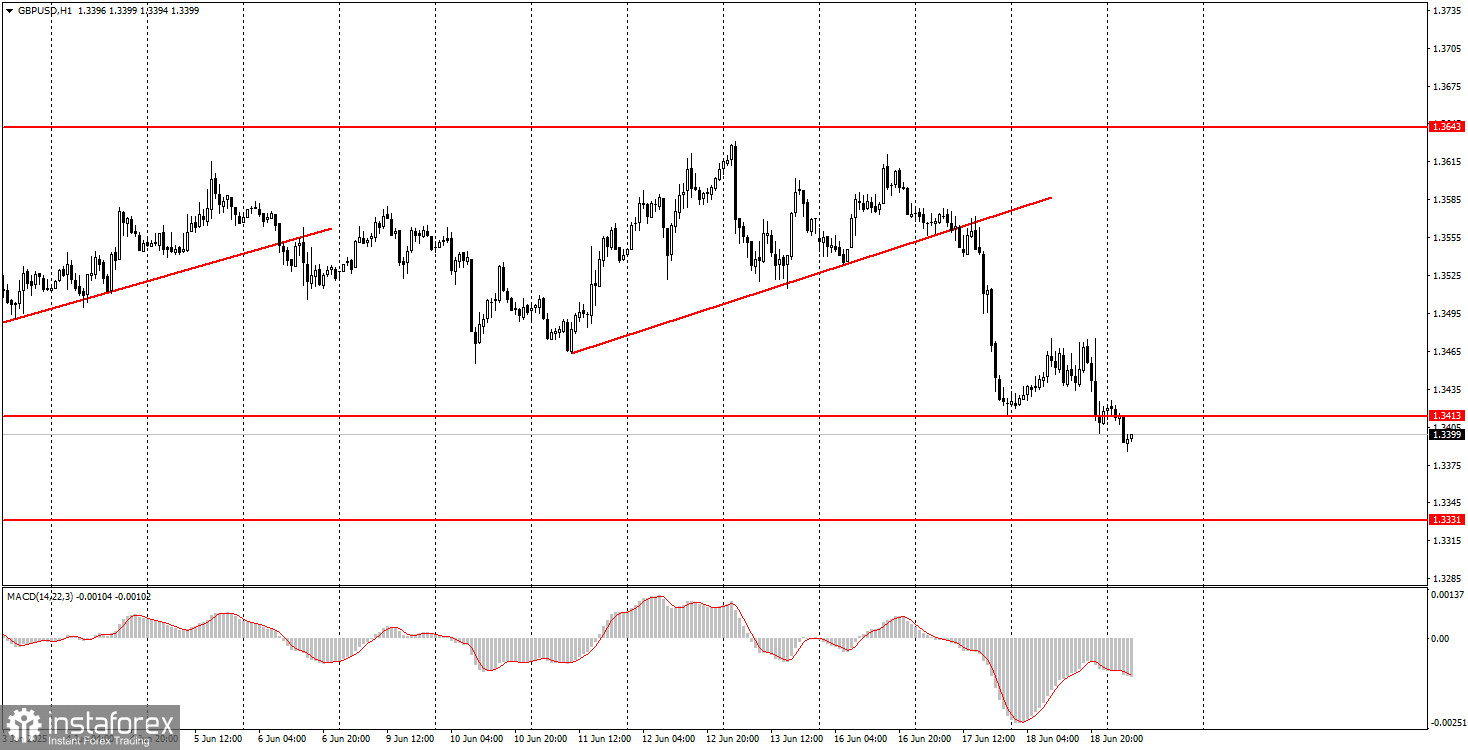
On the hourly timeframe, the GBP/USD pair continues to look solely toward Trump and remains highly skeptical of his policies. Therefore, as before, the market uses every opportunity to sell the dollar rather than buy it. This will continue until the market sees real signs of an end to the trade war and until Trump stops making decisions beyond his authority. From time to time, the dollar may show signs of growth—after all, even it cannot fall every single day—but such events remain rare for now.
On Thursday, the GBP/USD pair may continue to respond to the Fed meeting results, even though there is nothing left to price in. At midday, the Bank of England meeting is expected, which will likely trigger another spike in volatility.
On the 5-minute timeframe, current levels to trade around are: 1.3043, 1.3102–1.3107, 1.3203–1.3211, 1.3259, 1.3329–1.3331, 1.3413–1.3421, 1.3518–1.3535, 1.3580–1.3592, 1.3643–1.3652, 1.3695, 1.3740. On Thursday, the only notable scheduled event in the UK is the Bank of England's policy decision. No other major events are expected during the day.
Support and Resistance Levels: These are target levels for opening or closing positions and can also serve as points for placing Take Profit orders.
Red Lines: Channels or trendlines indicating the current trend and the preferred direction for trading.
MACD Indicator (14,22,3): A histogram and signal line used as a supplementary source of trading signals.
Important Events and Reports: Found in the economic calendar, these can heavily influence price movements. Exercise caution or exit the market during their release to avoid sharp reversals.
Forex trading beginners should remember that not every trade will be profitable. Developing a clear strategy and practicing proper money management are essential for long-term trading success.
InstaForex analytical reviews will make you fully aware of market trends! Being an InstaForex client, you are provided with a large number of free services for efficient trading.


