 Stay
Stay 
Trading Conditions
Products
Tools


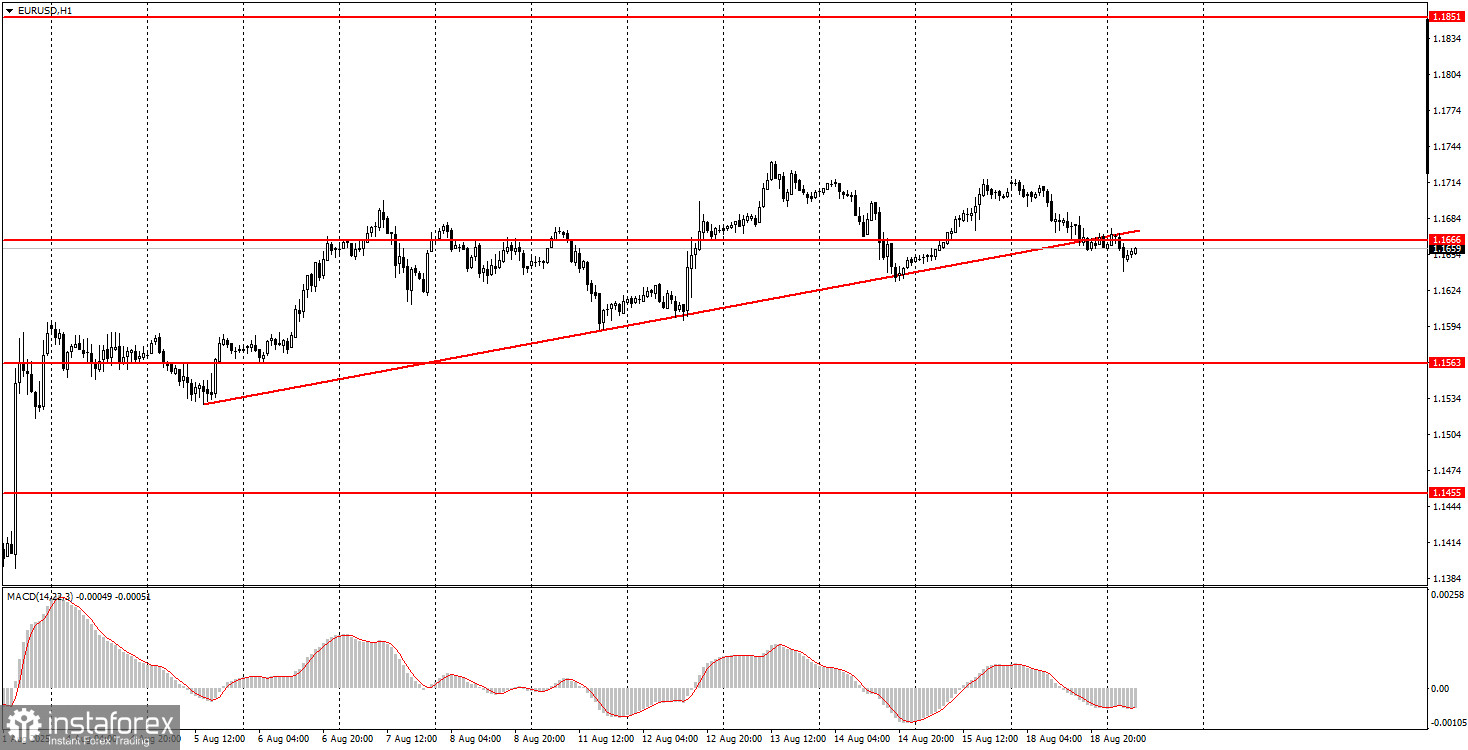
On Monday, the EUR/USD currency pair began a new wave of decline, which had nothing to do with fundamentals or macroeconomics. During the first trading day of the week, there were simply no significant reports or events. In the evening in Washington, Donald Trump held a meeting with EU and Ukrainian leaders on resolving the military conflict between Ukraine and Russia. Progress was made, all sides called the meeting productive, and there are plans for a meeting between Vladimir Putin, Volodymyr Zelensky, and Trump, which could put an end to the nearly 4-year war. This is excellent news, but not for the U.S. dollar. We consider yesterday's strengthening to be a coincidence. The trendline has been broken, but in our opinion, this does not open up any growth prospects for the dollar. The U.S. currency can still count only on corrections.
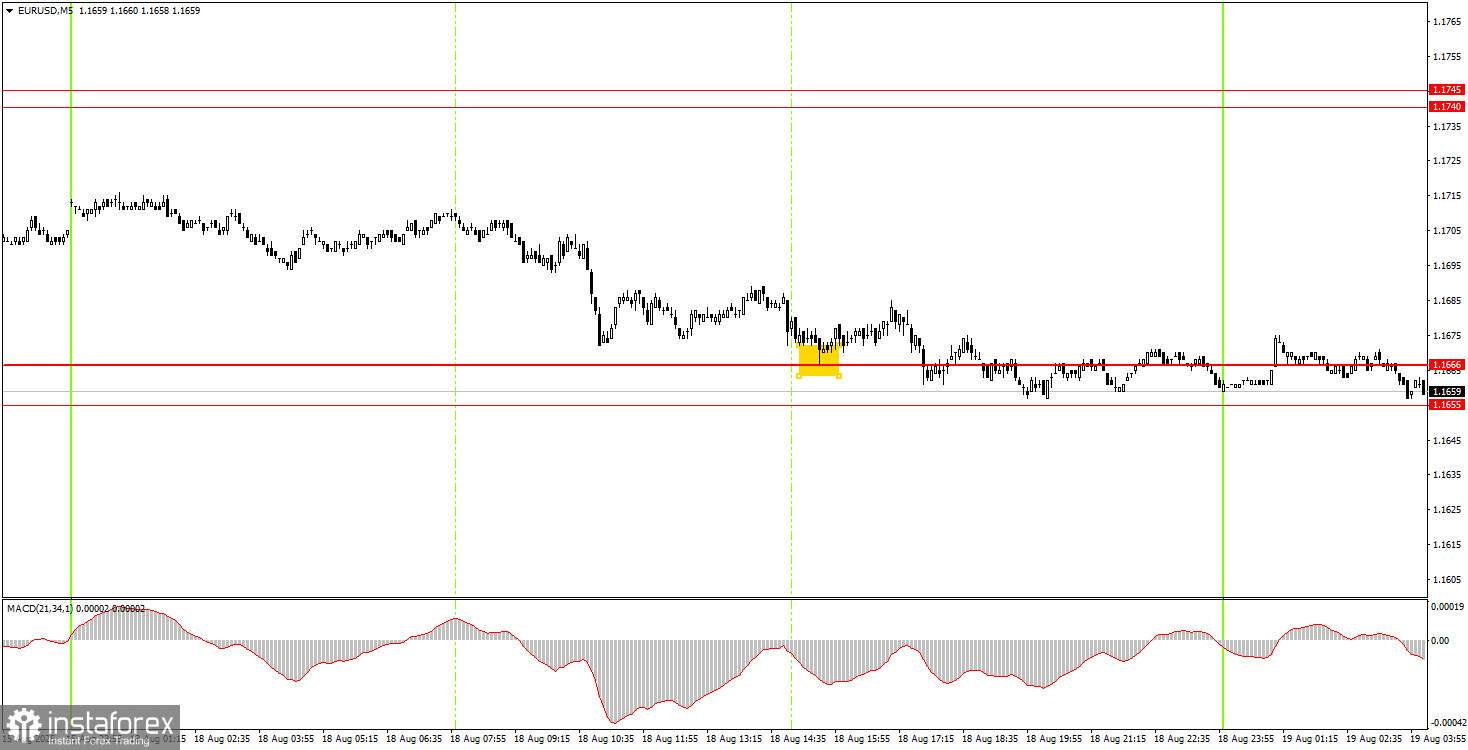
On the 5-minute timeframe, no trading signals were formed on Monday, and volatility was again weak. The price rebounded once from the 1.1666 level but failed to rise by even 15 pips, and by the end of the day it traded in a flat range between 1.1655 and 1.1666. Thus, novice traders could have opened a buy trade, but it would have brought neither profit nor loss.
On the hourly timeframe, the EUR/USD pair has every chance to continue the uptrend that has been forming since the beginning of this year. The situation for the dollar continues to worsen day by day. The Federal Reserve may soon resume its cycle of monetary policy easing, while the de-escalation of the military conflict between Ukraine and Russia could increase demand for risk currencies rather than the dollar. Trump continues to impose tariffs against all countries, so we see no grounds for strengthening the U.S. currency.
On Tuesday, the EUR/USD pair may resume upward movement despite breaking through the trendline. Thus, long positions will remain relevant today with targets at 1.1740–1.1750 if the 1.1655–1.1666 area is broken. Shorts can be considered on a confirmed rebound from the 1.1655–1.1666 area with a target at 1.1563. However, traders should probably not expect high volatility again today.
On the 5-minute timeframe, the levels to consider are: 1.1198–1.1218, 1.1267–1.1292, 1.1354–1.1363, 1.1413, 1.1455–1.1474, 1.1527, 1.1552–1.1563–1.1571, 1.1655–1.1666, 1.1740–1.1745, 1.1808, 1.1851, 1.1908. For Tuesday, no significant events or reports are scheduled in the Eurozone or the U.S. Several secondary reports will be released in the U.S., but they are unlikely to affect traders' sentiment significantly.
Support and Resistance Levels: These are target levels for opening or closing positions and can also serve as points for placing Take Profit orders.
Red Lines: Channels or trendlines indicating the current trend and the preferred direction for trading.
MACD Indicator (14,22,3): A histogram and signal line used as a supplementary source of trading signals.
Important Events and Reports: Found in the economic calendar, these can heavily influence price movements. Exercise caution or exit the market during their release to avoid sharp reversals.
Forex trading beginners should remember that not every trade will be profitable. Developing a clear strategy and practicing proper money management are essential for long-term trading success.
InstaForex analytical reviews will make you fully aware of market trends! Being an InstaForex client, you are provided with a large number of free services for efficient trading.


