 Stay
Stay 
Trading Conditions
Products
Tools


Bitcoin and Ether declined sharply yesterday, and there are several objective reasons for this. One of them is the lack of new "fuel." According to the latest weekly report from CoinShares, last week saw net outflows from cryptocurrency investment products issued by asset managers such as BlackRock, Grayscale, and Fidelity reach 1.4 billion US dollars. This is the largest figure since March. It indicates that risk appetite has decreased, and flows have turned negative for both Bitcoin and Ether.

Such capital outflows inevitably cause concern in the cryptocurrency market. Institutional investors, whose funds previously fueled the growth of digital assets, are now demonstrating a clear decline in interest. The reasons may vary, ranging from macroeconomic uncertainty to significant overbought conditions in the market that require a correction.
The outflow from Bitcoin and Ether, the two largest and most liquid cryptocurrencies, appears particularly alarming. This suggests that even blue chips of the crypto market are not immune to negative investor sentiment. Investors may be locking in profits after the recent rally or reallocating assets into more conservative instruments.
In the near term, this trend could exert significant pressure on cryptocurrency prices. Lower liquidity and a predominance of sellers over buyers will inevitably lead to further volatility and, possibly, a market correction.
The largest outflows were observed in Bitcoin ETFs, amounting to roughly 1 billion dollars, while losses in Ether-based products totaled about 440 million dollars.
It is worth recalling that not long ago, Federal Reserve Chairman Jerome Powell hinted at a possible rate cut and noted the potential downside risks associated with President Trump's aggressive tariff policy, which triggered buying in the cryptocurrency market. However, despite the initial rise, there was no continued support, which has returned the cryptocurrency market to a more familiar course.
Trading recommendations:
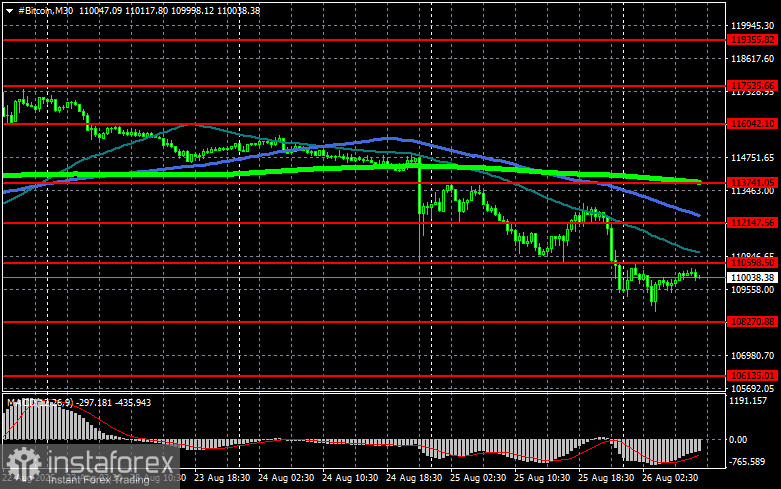
Regarding the technical picture for Bitcoin, buyers are currently targeting a return to the $110,600 level, which opens a direct path to $112,100, with $113,700 within easy reach. The furthest target is the high around $116,000. Overcoming this level would signal the strengthening of a bull market. If Bitcoin declines, buyers are expected at the $108,200 level. A move below this area could quickly drive BTC down to about $106,100. The furthest target on the downside would be the $103,400 area.
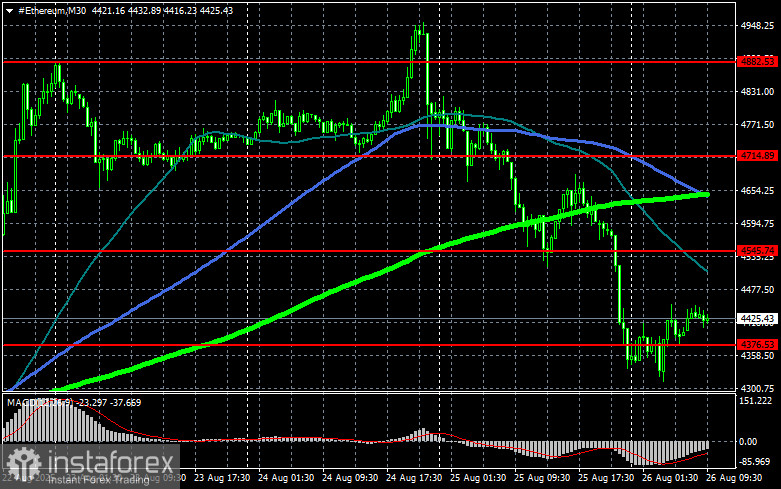
As for the technical outlook for Ethereum, a clear consolidation above $4,545 opens a direct path to $4,714. The furthest target is the high around $4,882, a breakout above which would indicate strengthened bullish sentiment and renewed buyer interest. If Ether declines, buyers are expected at $4,376. Moving below this area could quickly send ETH to $4,237. The furthest downside target would be the $4,077 area.
What we see on the chart:
- The red line indicates support and resistance, from which either a slowdown or active price growth is expected in the near term.
- The green line represents the 50-day moving average.
- The blue line represents the 100-day moving average.
- The light green line represents the 200-day moving average.
The intersection or testing of price against the moving averages typically either stops or gives the market new momentum.
InstaForex analytical reviews will make you fully aware of market trends! Being an InstaForex client, you are provided with a large number of free services for efficient trading.


