 Stay
Stay 
Trading Conditions
Products
Tools


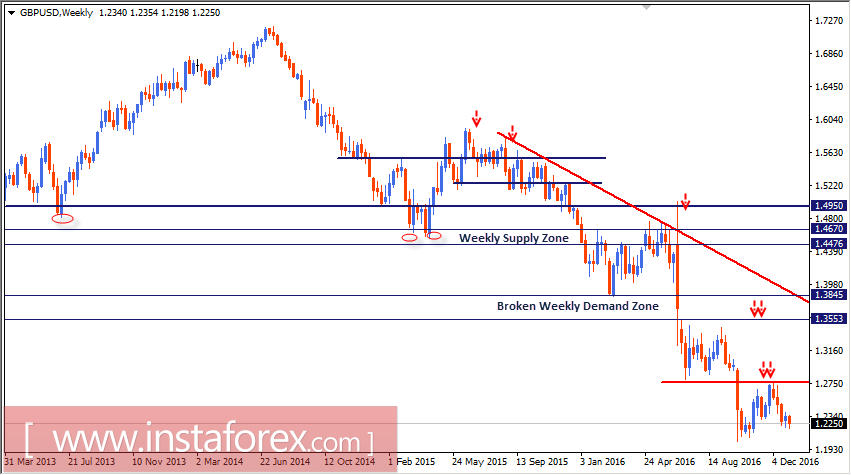
The price zone between 1.3845 and 1.3550 (historical bottoms set in January 2009) was considered a significant demand zone to be watched for bullish recovery.
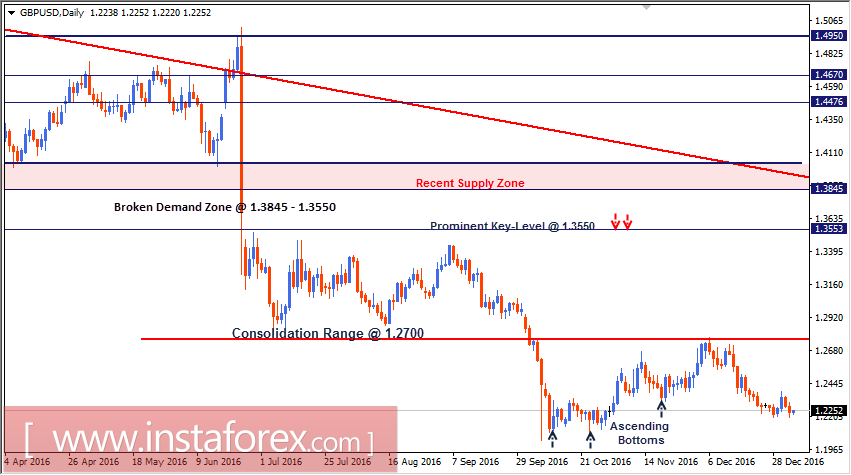
However, by the end of June a significant bearish break below 1.3550 was expressed as seen on the depicted charts (fundamental reasons). Bearish persistence below the demand level at 1.3550 enhanced the bearish scenario toward the price levels around 1.2700 (Bearish projection target).
Since then, the GBP/USD pair has been trapped inside the depicted consolidation range above 1.2700 until a bearish breakout took place on October 6.
Daily persistence below 1.2700 confirmed the bearish Flag pattern. That is why, a bearish projection target would be located around 1.2020.
Recently, bullish recovery was manifested around 1.2080. That is why, a bullish pullback was executed toward 1.2700-1.2750.
Risky traders considered the recent bullish pullback toward the price zone of 1.2700-1.2750 for a valid SELL entry. S/L should be set as a daily candlestick closure above 1.2750. T/P levels should be located at 1.2300 and 1.2100.
This SELL entry should be monitored cautiously as the ascending bottoms around the price levels of 1.2120 and 1.2320 may apply significant bullish pressure against the supply zone of 1.2700-1.2750 thus threatening the suggested trade.
On the other hand, price action should be watched around the current price levels (1.2300-1.2260) where a previous top was recently established on October 19. Hence, bullish rejection is anticipated around the current price levels.
InstaForex analytical reviews will make you fully aware of market trends! Being an InstaForex client, you are provided with a large number of free services for efficient trading.


