 Stay
Stay 
Trading Conditions
Products
Tools

USDX is still holding its structure above the 200 SMA on H1 chart and it looks like we can expect a breakout above 101.43 in coming hours. If bulls return to the market, a rally to test the 102.39 is likely to happen, while a pullback should deliver another leg lower to reach the support zone of 100.44, which is also below the 200-hour moving average.
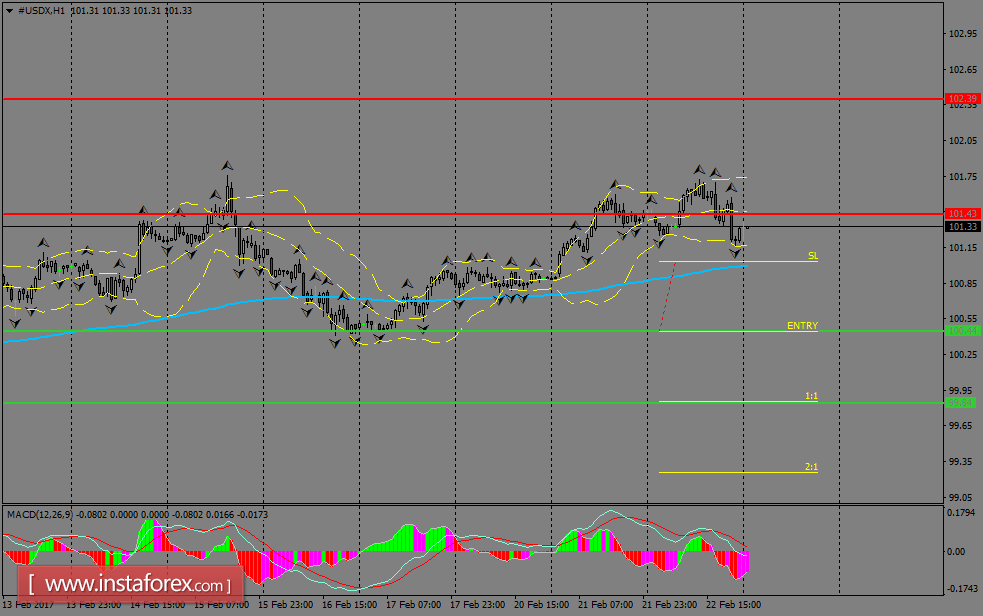
H1 chart's resistance levels: 101.43 / 102.38
H1 chart's support levels: 100.44 / 99.84
Trading recommendations for today: Based on the H1 chart, place sell (short) orders only if the USD Index breaks with a bearish candlestick; the support level is at 100.44, take profit is at 99.84 and stop loss is at 101.06.
InstaForex analytical reviews will make you fully aware of market trends! Being an InstaForex client, you are provided with a large number of free services for efficient trading.


