 Stay
Stay 
Trading Conditions
Products
Tools


Technical Outlook:
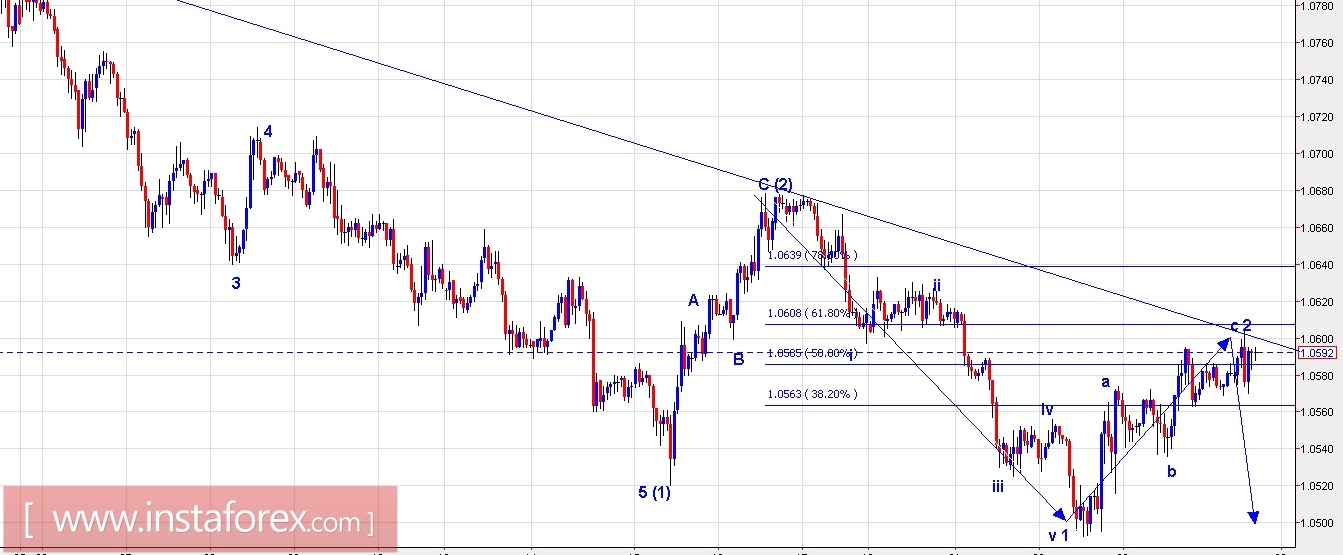
The hourly chart is indicating a perfect convergence of the trend-line resistance, the former support becoming future resistance, and the Fibonacci resistance for EUR/USD. Going through the wave structure, the pair seems to have terminated wave 2 within the presumed wave (3) as seen on the chart. Wave (1) was an impulse that terminated at 1.0502, while wave (2) correction terminated at 1.0680 levels. Wave (3), which should unfold into 5 sub waves, seems to have already completed waves 1 (1.0492) and 2 (1.0600) levels. If this count holds true, wave 3 of (3) should drop from here, and it could be fast and sharp. Also note that the trend-line resistance is seen around same levels, capping any further rallies. Immediate resistance is seen at 1.0680 levels while support is at 1.0492 levels. Remain short now.
Trading plan:
Selling on rallies was recommended yesterday. Prices have almost triggered 1.0600 levels now, downside is seen at parity. Please exit long positions now. Remain short, stop at 1.0850, target is 1.0300 and 1.0000.
USDJPY chart setups:
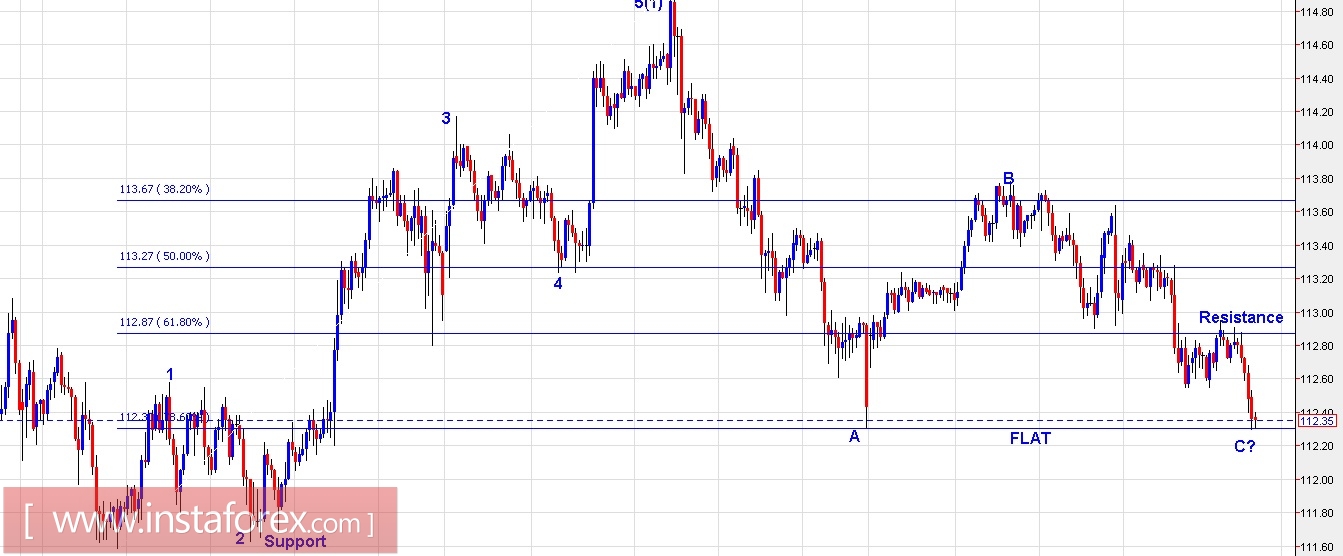
Technical Outlook:
The hourly chart depicted above shows a slight change in the wave structure. The drop from 114.95 levels has taken shape of a complex correction A-B-C as shown here. Please note that the earlier rally was unfolded into an impulse (5 waves), hence ideally prices should remain above 111.60 levels going forward. Also note that the pair has again tested the Fibonacci 0.786 support levels and a bullish bounce should be expected here. Only if prices break below 111.60 levels, the structure would change. Immediate support is seen at 111.60, while resistance is at 113.00 levels. Prices have dropped slightly lower below 112.80 as expected yesterday, but holding longs is preferred trading strategy for now.
Trading plan:
Please remain long for now, stop at 111.60, target is 117.00.
Fundamental Outlook:
The CAD Consumer Price Index is scheduled for release at 08:30 am EST, forecast is 1.6%. It should not have much impact on the above pairs. Please trade according to suggestions given above. Both the above trading plans are good for the day. Targets can be expected in a few weeks.
Good luck!
InstaForex analytical reviews will make you fully aware of market trends! Being an InstaForex client, you are provided with a large number of free services for efficient trading.


