 Stay
Stay 
Trading Conditions
Products
Tools


Trading plan for 20/03/2017:
On Monday 20th of March, there is not much in event calendar, but the market participants will be paying attention to the Wholesale Sales data from Canada that will be released during the American session.
USD/CAD analysis fro 20/03/2017:
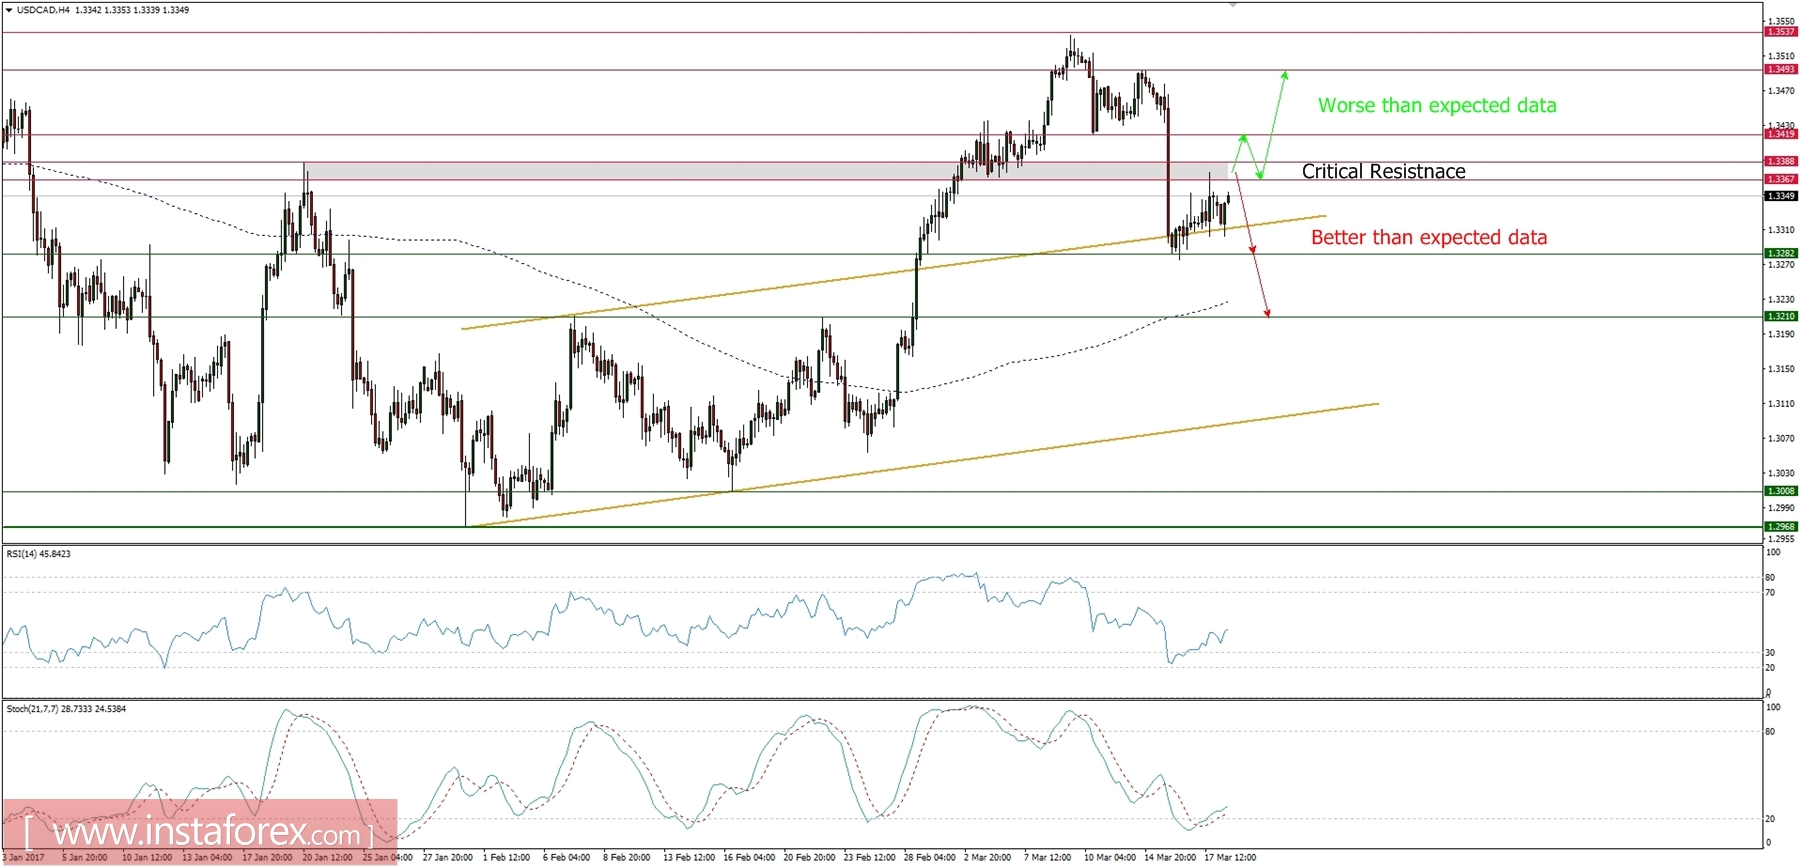
The Wholesale Sales data are scheduled for release at 12:30 pm GMT today and the market participants expect, that the value of sales made by Canadian wholesaler will decrease from 0.7% to 0.3% on a month-to-month basis. The changes in Wholesale Sales can be used as an early indicator for the overall direction of the retail sector, consumption and the economy. In this case, any data worse than 0.3% might be the first clue of incoming problems in this sector of the economy.
Let's now take a look at the USD/CAD technical picture at the H4 timeframe. The price had bounced from the upper channel line but is still trading inside of the congestion zone between the levels of 1.3282 - 1.3367. The most important technical resistance zone is still the gray rectangle between the levels of 1.3367 - 1.3388 and only a sustained breakout higher would push the price higher towards the level of 1.3493.
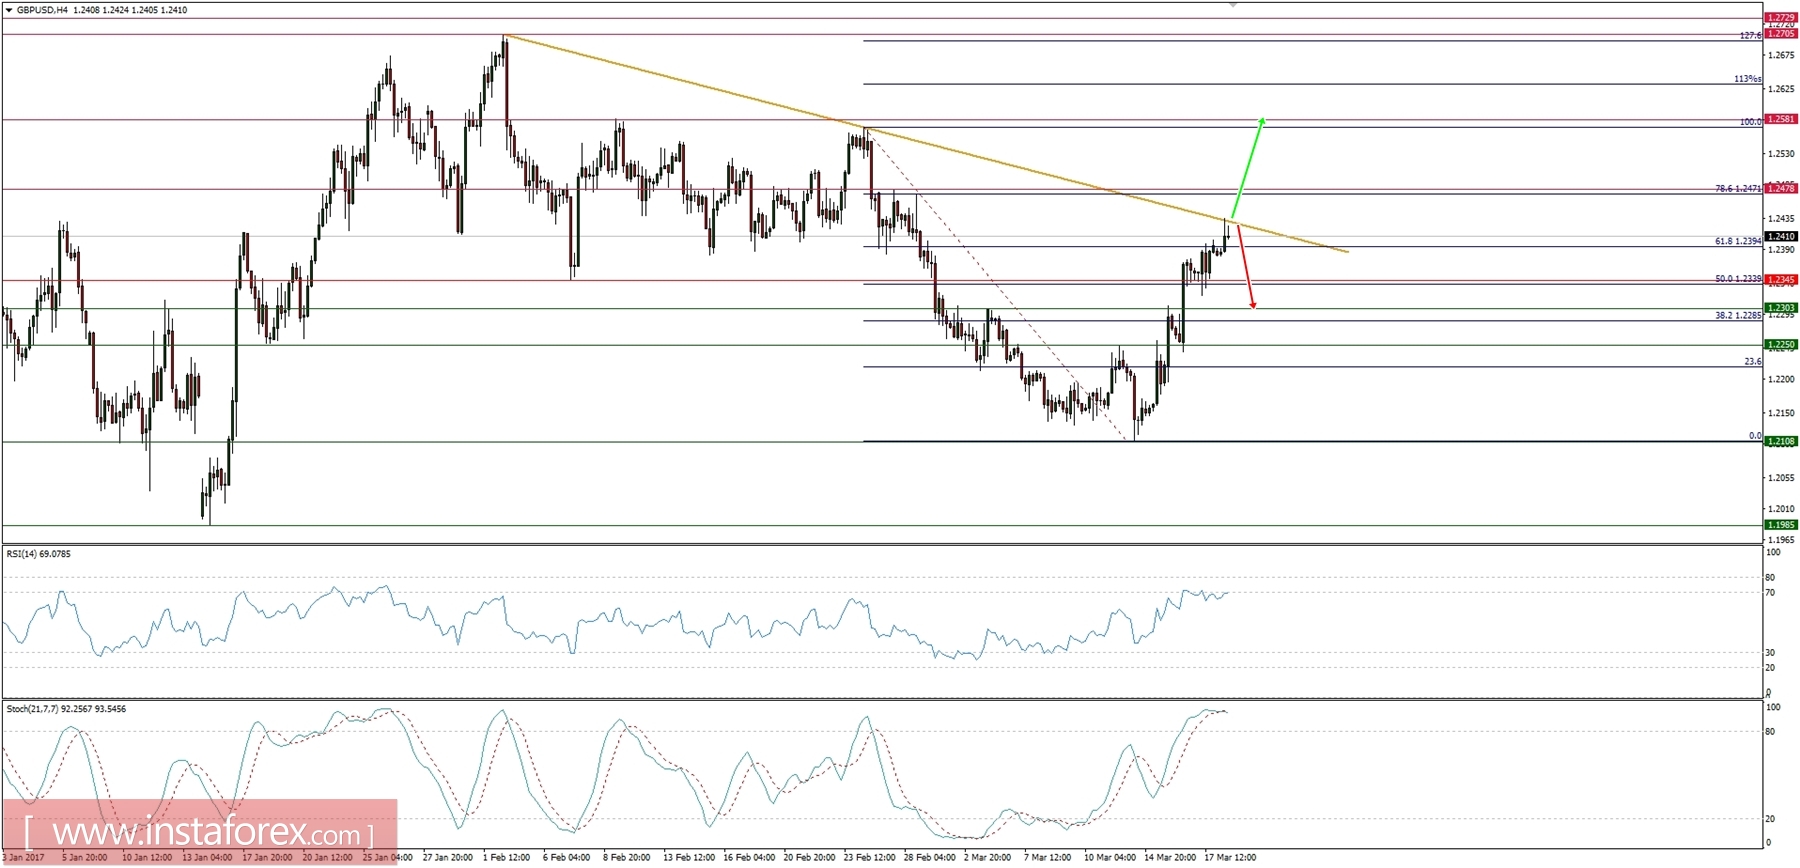
Market snapshot - GBP/USD at the trend line resistance
At the H4 timeframe, the price just went upward in order to test the golden trend line dynamic resistance around the level of 1.2435. The market was strong enough to break out above the 61%Fibo at the level of 1.2394, but the question now is whether the breakout will sustain or the market will reverse. A critical moment here both for bulls and bears.
Market snapshot - Crude Oil fails to rally higher
The bulls camp were not strong enough to sustain the recent breakout above the gray rectangle resistance area and now the price is trading just above the technical support at the level of 47.90. More weakness is expected here and the next level to keep an eye on is all important technical support at the level of 47.09.

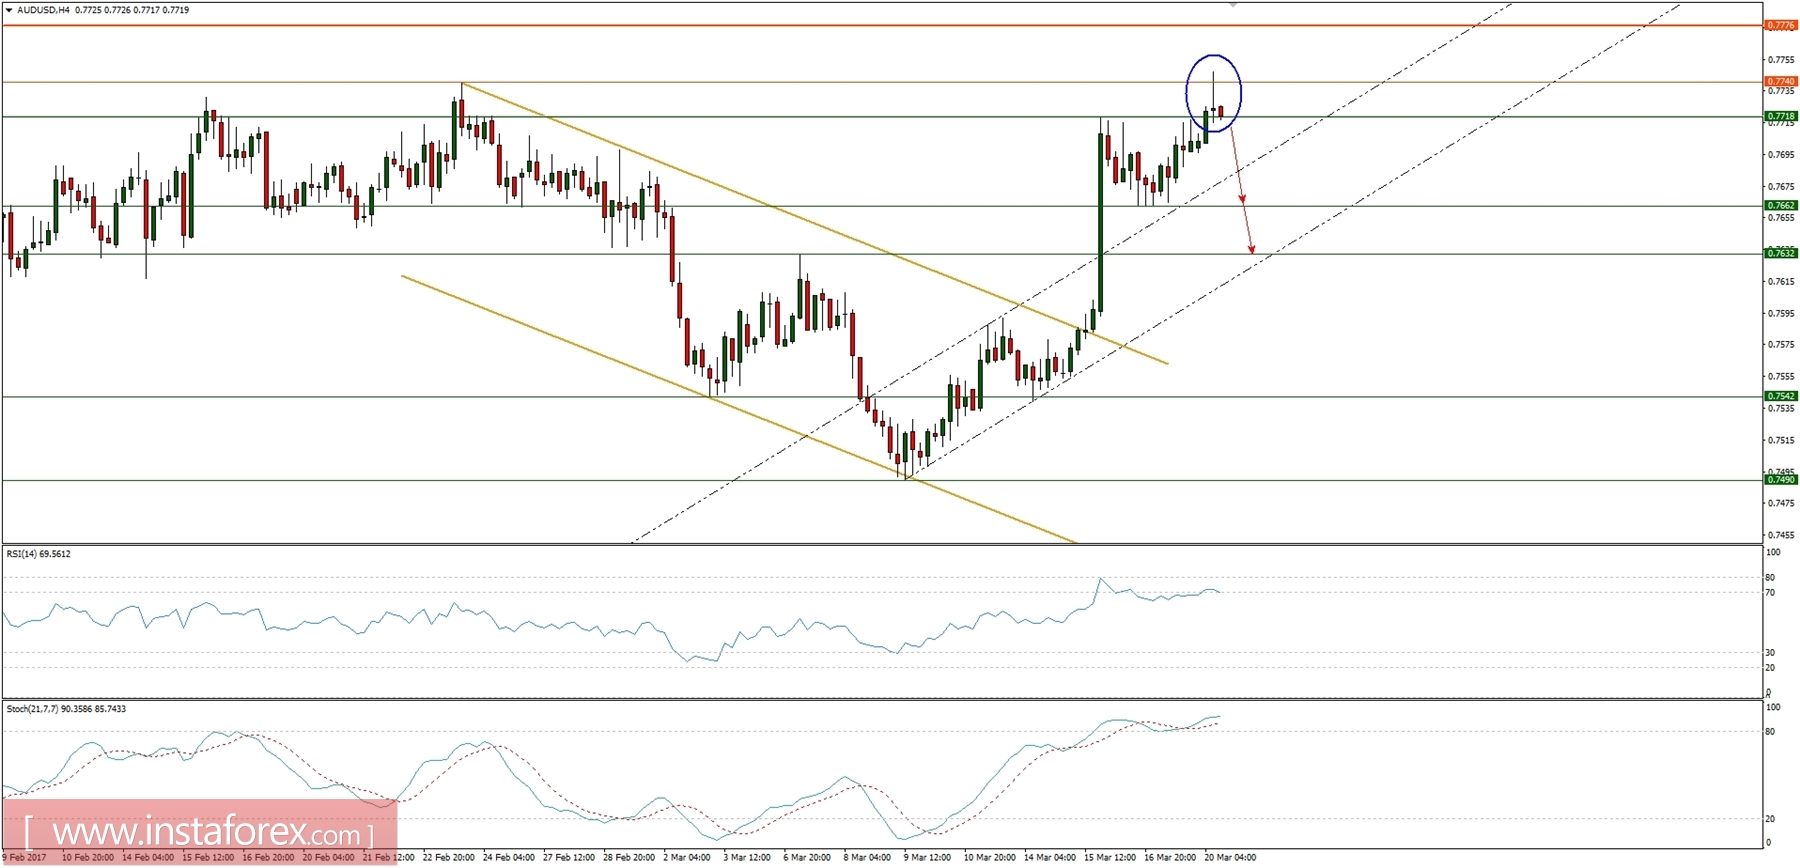
Market snapshot - AUD/USD prints Doji candle at H4 time frame chart
A clear Doji candle had been made at H4 chart, just at the top of the range zone, but below the technical resistance at the level of 0.7777. If the next cancel will confirm this is the temporary top ( must be any down candle formation), then the market should decline towards the next support at the level of 0.7662 and can even extend to the level of 0.7632 due to the overbought trading conditions.
InstaForex analytical reviews will make you fully aware of market trends! Being an InstaForex client, you are provided with a large number of free services for efficient trading.

