 Stay
Stay 
Trading Conditions
Products
Tools


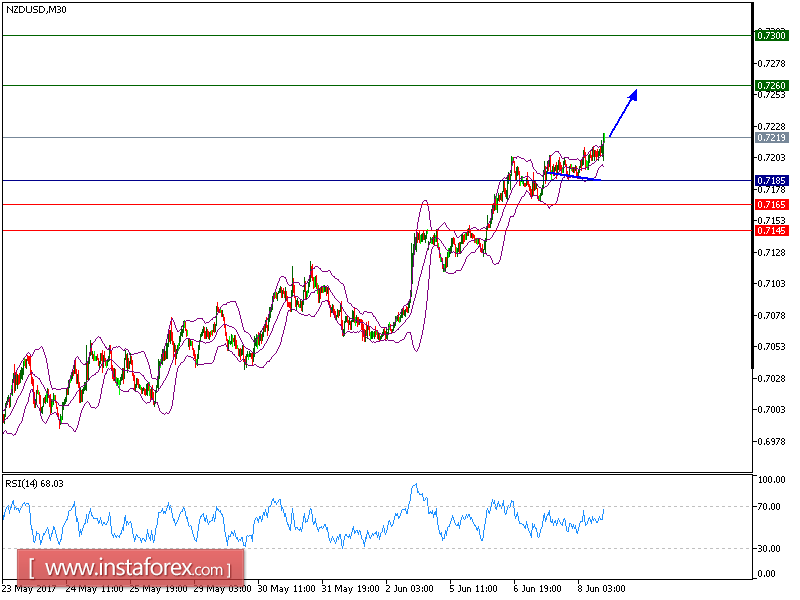
The pair is trading in a higher range as predicted. Today, NZD/USD is expected to continue its upside movement. The pair is consolidating above the key support at 0.7185, which should limit the downside potential. The relative strength index is mixed to bullish. Even though a continuation of the consolidation cannot be ruled out, its extent should be limited.
Therefore, as long as 0.7185 is not broken, look for a further rise to 0.7260 and even to 0.7300 in extension.
At present, the pair is trading above its pivot point. It is likely to trade in a higher range as long as it remains above its pivot point. Therefore, long position is recommended with the first target at 0.7260 and the second one at 0.7300. In the alternative scenario, short position is recommended with the first target at 0.7165 if the price moves below its pivot points. A break of this target is expected to push the pair further downwards, and one may expect the second target at 0.7145. The pivot point lies at 0.7185.
Strategy: BUY at dips, Stop Loss: 0.7185, Take Profit: 0.7260
Graph Explanation: The black line shows the pivot point; the present price above pivot point indicates the bullish position and below pivot points indicates the short position. The red lines shows the support levels and the green line indicates the resistance levels. These levels can be used to enter and exit trades.
Resistance levels: 0.7260, 0.7280, and 0.73000
Support levels: 0.7165,0.7145, and 0.7100
InstaForex analytical reviews will make you fully aware of market trends! Being an InstaForex client, you are provided with a large number of free services for efficient trading.


