 Stay
Stay 
Trading Conditions
Products
Tools

GBP/USD remains confined into a sideways structure which is being capped by the 200 SMA at H1 chart. The resistance zone of 1.2826 is the next level of interest for sellers, but the downside is still the preferred scenario so far. If the pair manages to break below 1.2741, it can reach the 1.2660 level for the short-term.
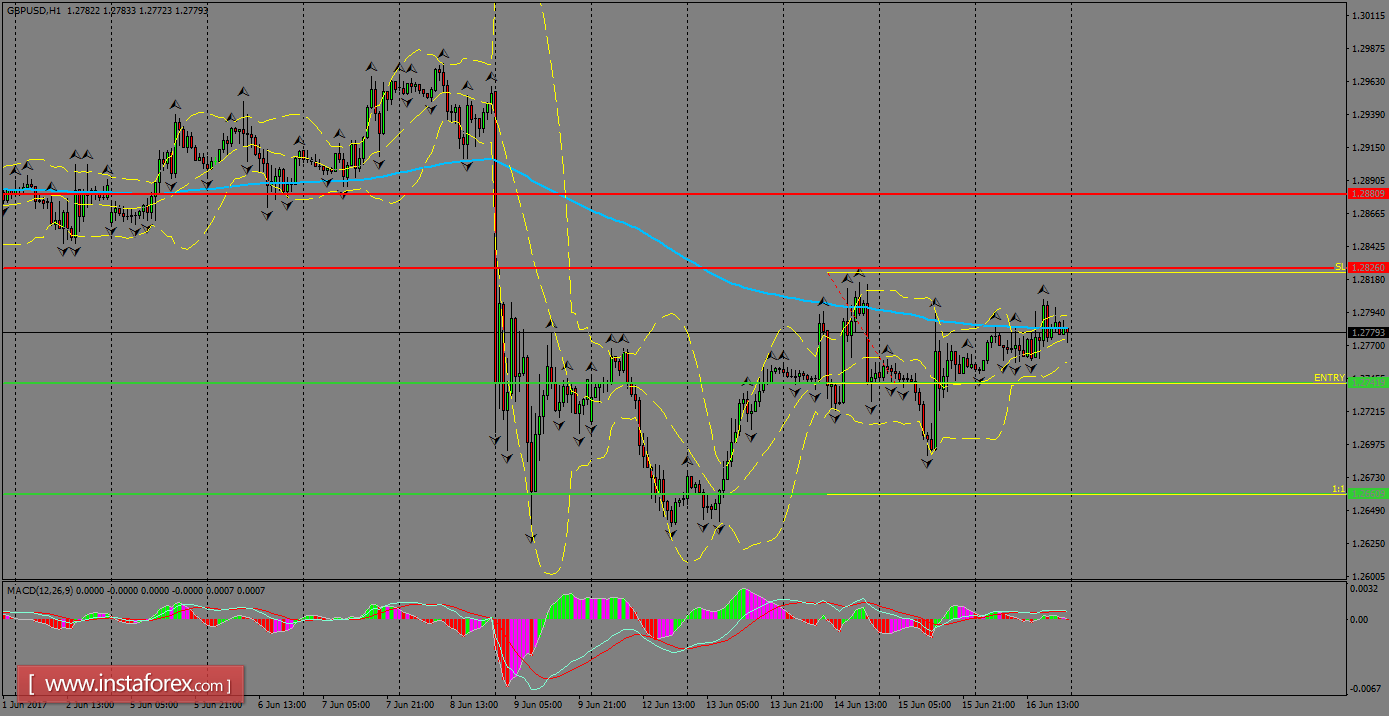
H1 chart's resistance levels: 1.2826 / 1.2880
H1 chart's support levels: 1.2741 / 1.2660
Trading recommendations for today: Based on the H1 chart, sell (short) orders only if the GBP/USD pair breaks a bearish candlestick; the support level is at 1.2741, take profit is at 1.2660 and stop loss is at 1.2823.
InstaForex analytical reviews will make you fully aware of market trends! Being an InstaForex client, you are provided with a large number of free services for efficient trading.


