 Stay
Stay 
Trading Conditions
Products
Tools

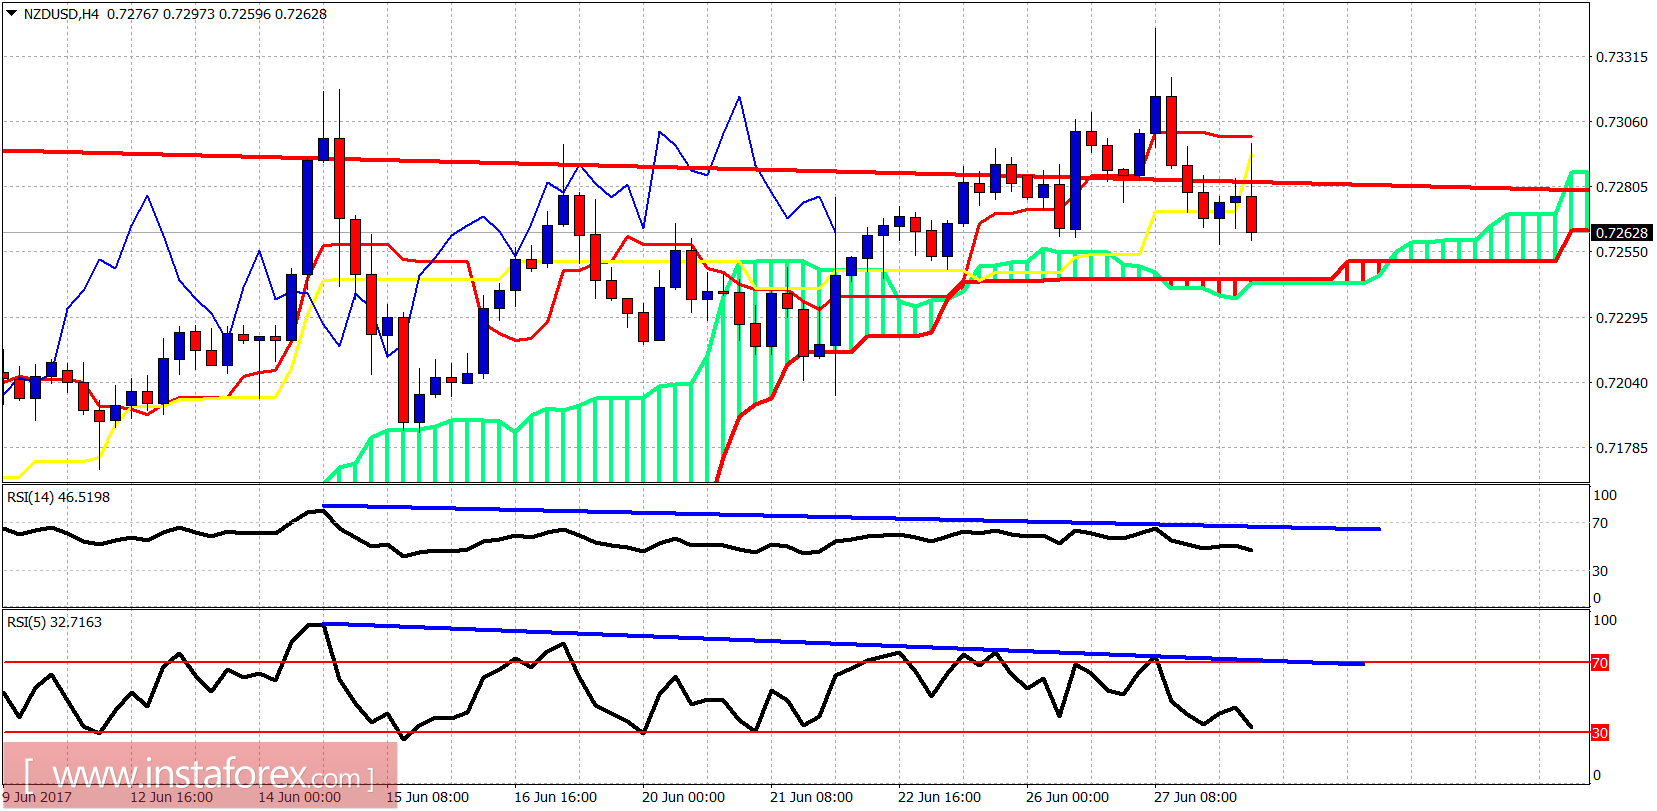
The price action here is very bearish. Technically we have a fake breakout and rejection. Bearish divergence signs. Reversal candle formations.
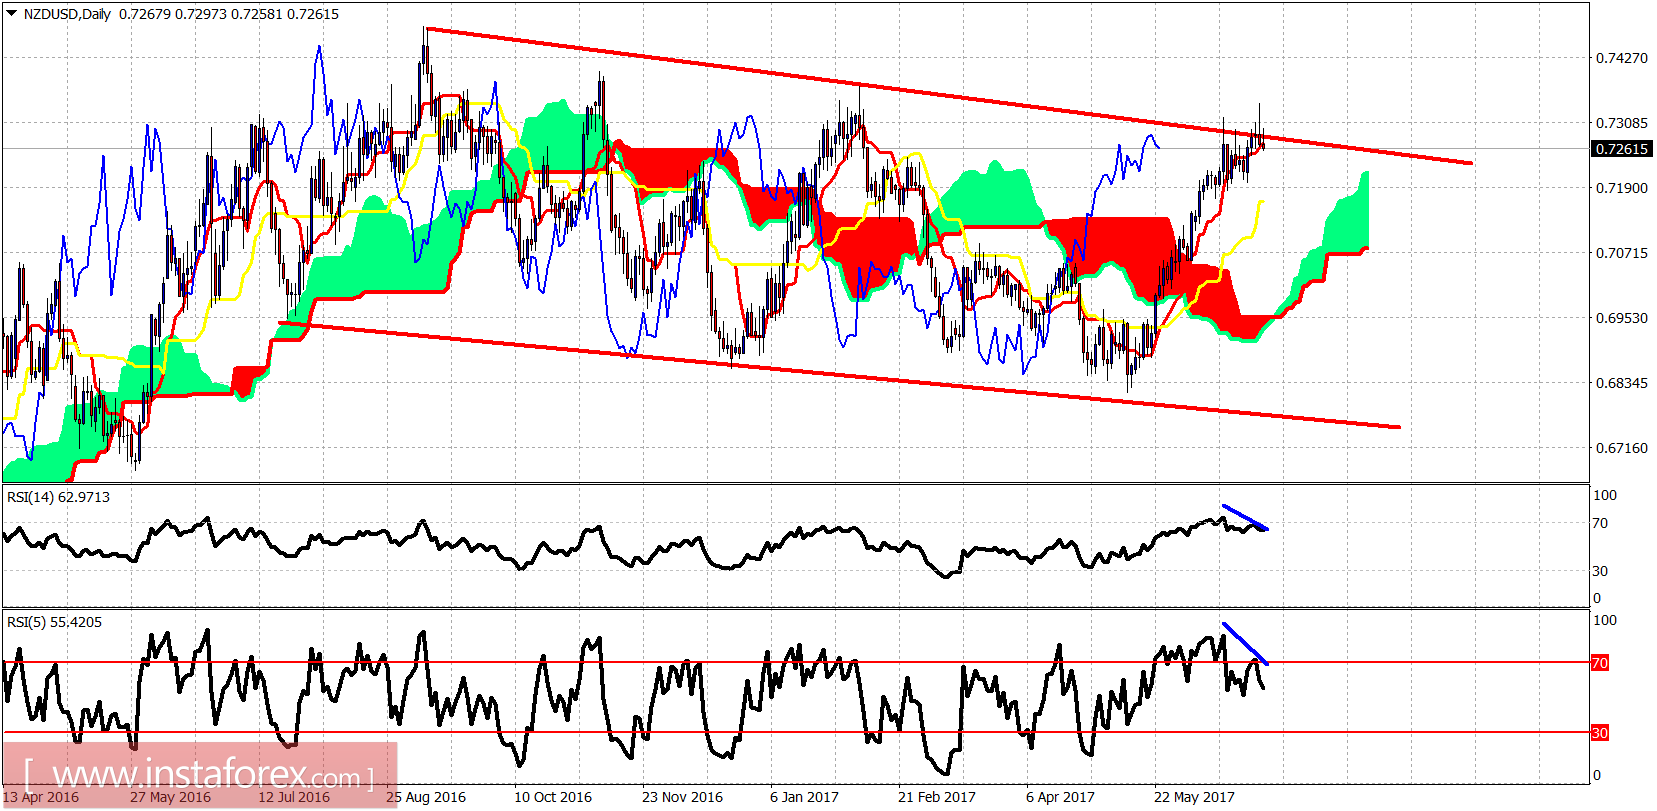
Red lines - bearish channel
The NZDUSD has made a false break out above the upper channel boundary and is turning downwards. I expect a deep pull back for this pair at least towards 0.7165 as the price is already trading below the tenkan-sen.
InstaForex analytical reviews will make you fully aware of market trends! Being an InstaForex client, you are provided with a large number of free services for efficient trading.


