 Stay
Stay 
Trading Conditions
Products
Tools

The pair suffered some losses during Thursday's session post-Fed and it seems that the 200 SMA in the H1 chart could act as a dynamic support. The overall bullish bias remains intact as long as the GBP/USD pair holds Wednesday's lows. However, if the support level of 1.3034 gives up, then we might expect a decline towards 1.2968.
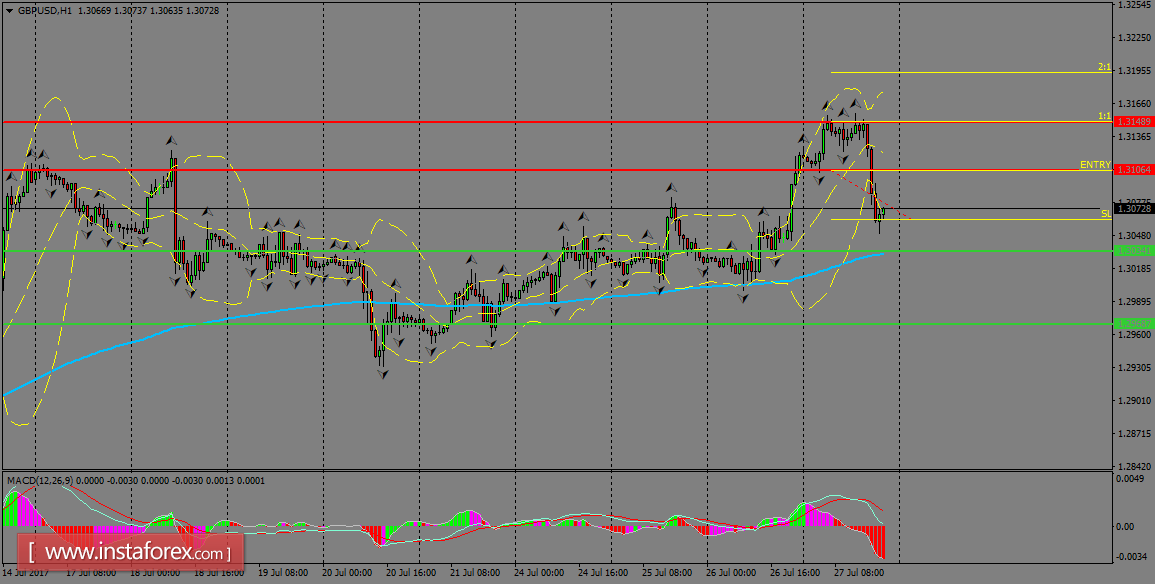
H1 chart's resistance levels: 1.3106 / 1.3148
H1 chart's support levels: 1.3034 / 1.2968
Trading recommendations for today: Based on the H1 chart, buy (long) orders only if the GBP/USD pair breaks a bullish candlestick. The resistance level is at 1.3106, take profit is at 1.3148 and stop loss is at 1.3062.
InstaForex analytical reviews will make you fully aware of market trends! Being an InstaForex client, you are provided with a large number of free services for efficient trading.


