 Stay
Stay 
Trading Conditions
Products
Tools

The pair is rallying and showing that bulls remain stronger across the board, with a breakout above the key level of 1.3153, which opens the door to test the next resistance around 1.3257. To the downside, we're expecting a support to be found in the 200 SMA at H1 chart once GBP/USD breaks below 1.3153. MACD indicator still supports the bullish scenario.
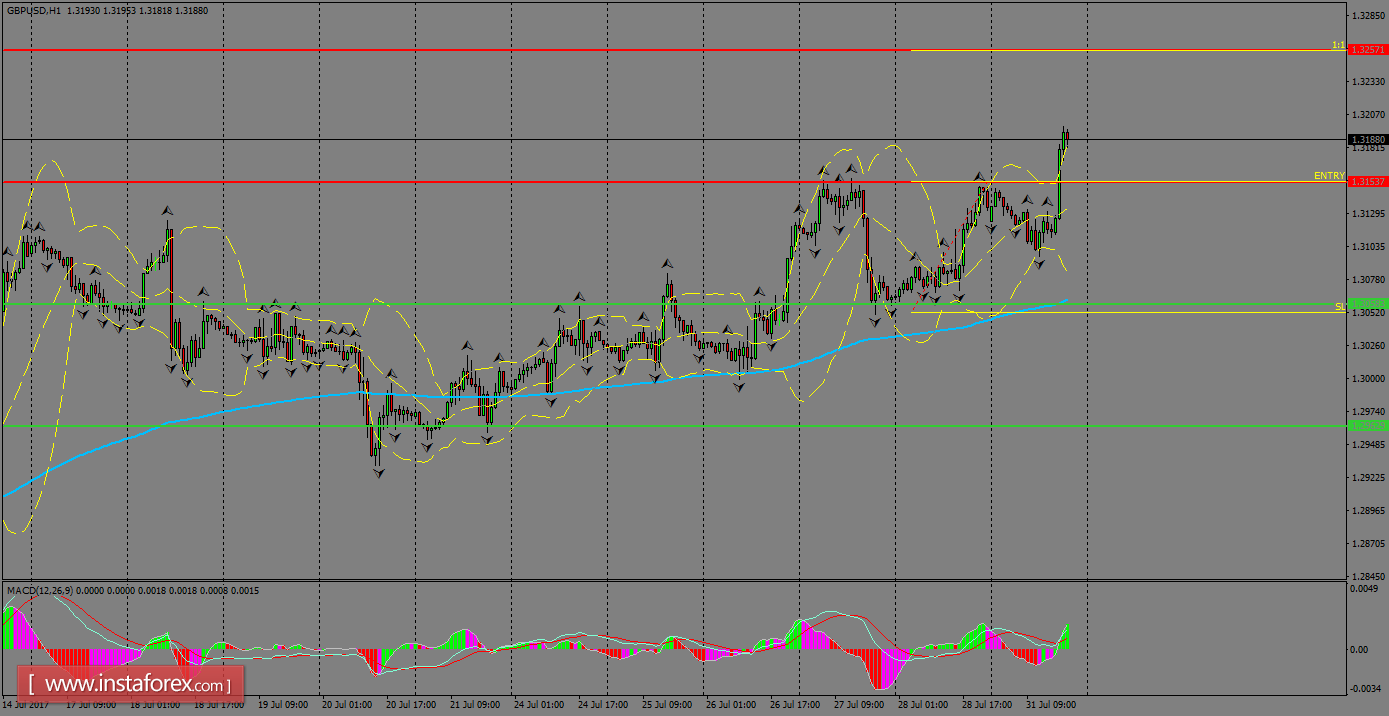
H1 chart's resistance levels: 1.3153 / 1.3257
H1 chart's support levels: 1.3058 / 1.2962
Trading recommendations for today: Based on the H1 chart, buy (long) orders only if the GBP/USD pair breaks a bullish candlestick; the resistance level is at 1.3153, take profit is at 1.3257 and stop loss is at 1.3051.
InstaForex analytical reviews will make you fully aware of market trends! Being an InstaForex client, you are provided with a large number of free services for efficient trading.


