 Stay
Stay 
Trading Conditions
Products
Tools


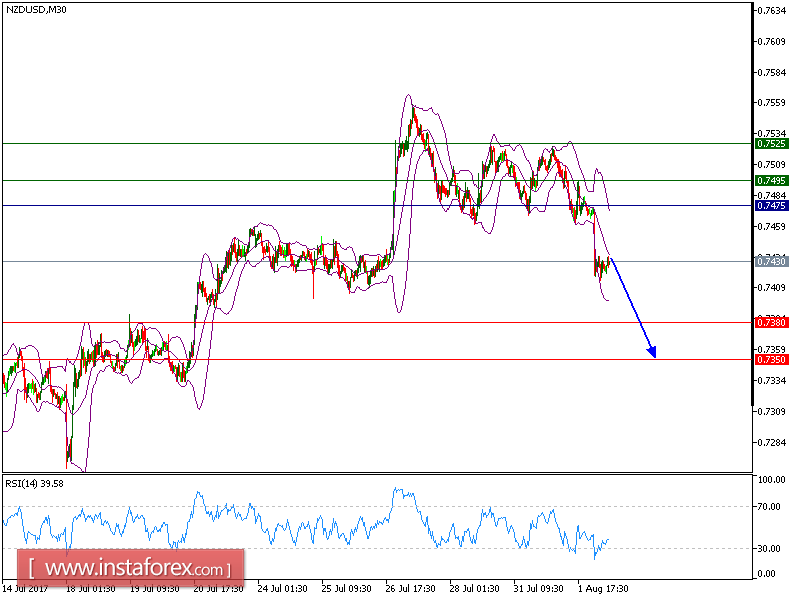
NZD/USD is expected to trade in a lower range and is under pressure. The pair broke below the lower boundary of Bollinger Bands, which indicated the continuation of a bearish trend. The downward momentum is further reinforced by declining 20-period and 50-period moving averages. The relative strength index broke below its 30 level.
To conclude, as long as 0.7475 is not surpassed, look for a further decline to 0.7380 and even to 0.7350 in extension.
Strategy: SELL Stop Loss: 0.7475 Take Profit: 0.7380
Chart Explanation:
The black line shows the pivot point. Currently, the price is above the pivot point which indicates the bullish position. If it remains below the pivot point, it will indicate the short position. The red lines show the support levels and the green line indicates the resistance levels. These levels can be used to enter and exit trades.
Resistance levels: 0.7495, 0.7525, and 0.7575
Support levels: 0.7380, 0.7350, and 0.7300
InstaForex analytical reviews will make you fully aware of market trends! Being an InstaForex client, you are provided with a large number of free services for efficient trading.


