 Stay
Stay 
Trading Conditions
Products
Tools

The index had limited price action during Monday's session, as thin liquidity dominated the markets, despite some sharp movements early in the American session. The greenback is now being capped by the dynamic resistance offered by the 200 SMA at H1 chart and one could expect further pullbacks. However, if it manages to consolidate above that moving average, the next target should be the 93.75 level.
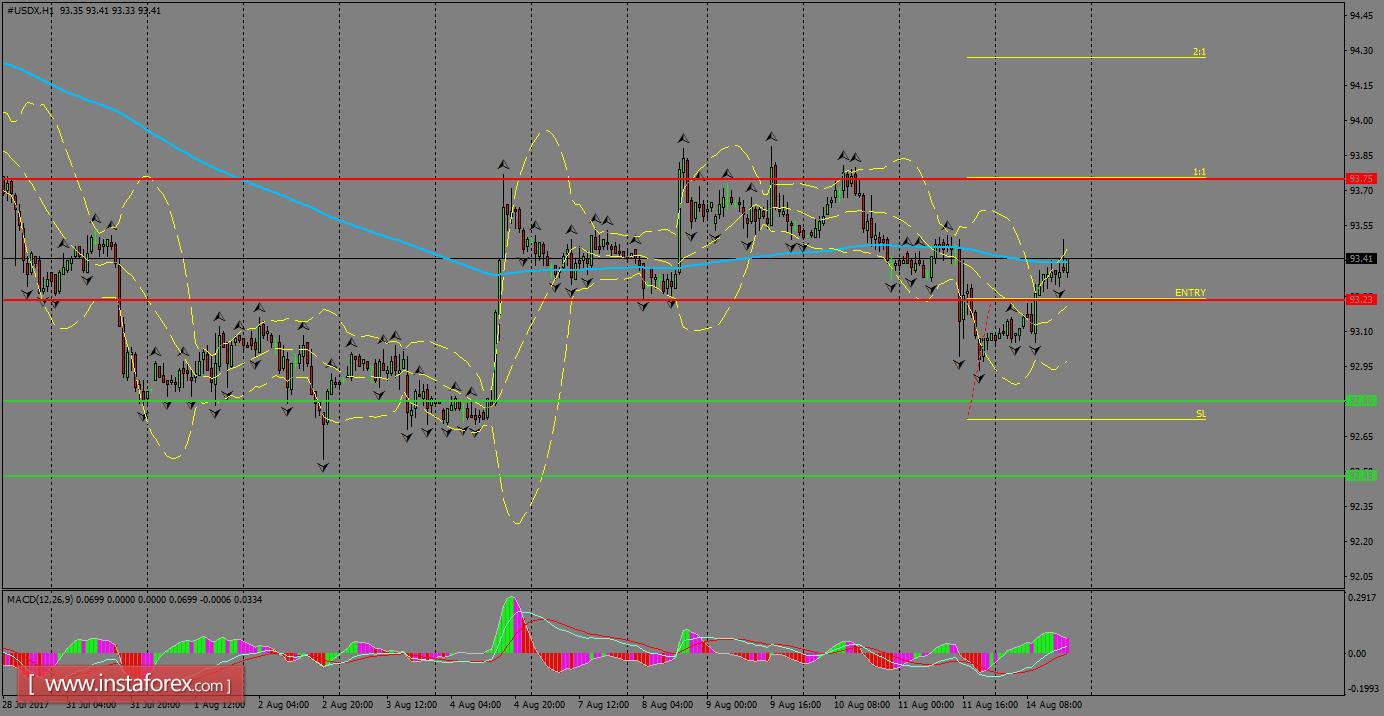
H1 chart's resistance levels: 93.23 / 93.75
H1 chart's support levels: 92.80 / 92.48
Trading recommendations for today: Based on the H1 chart, place buy (long) orders only if the USD Index breaks with a bullish candlestick; the resistance level is at 93.23, take profit is at 93.75 and stop loss is at 92.72.
InstaForex analytical reviews will make you fully aware of market trends! Being an InstaForex client, you are provided with a large number of free services for efficient trading.


