 Stay
Stay 
Trading Conditions
Products
Tools

The pair has made a new low below the 200 SMA at H1 chart and it's poised to test the support zone of 1.3309. The resistance zone of 1.3592 remains as a strong barrier for buyers and we can expect further declines in GBP/USD. Besides, the focus remains in a corrective phase and if the pair manages to consolidate below 1.3309, a decline is expected to take place towards 1.3209.
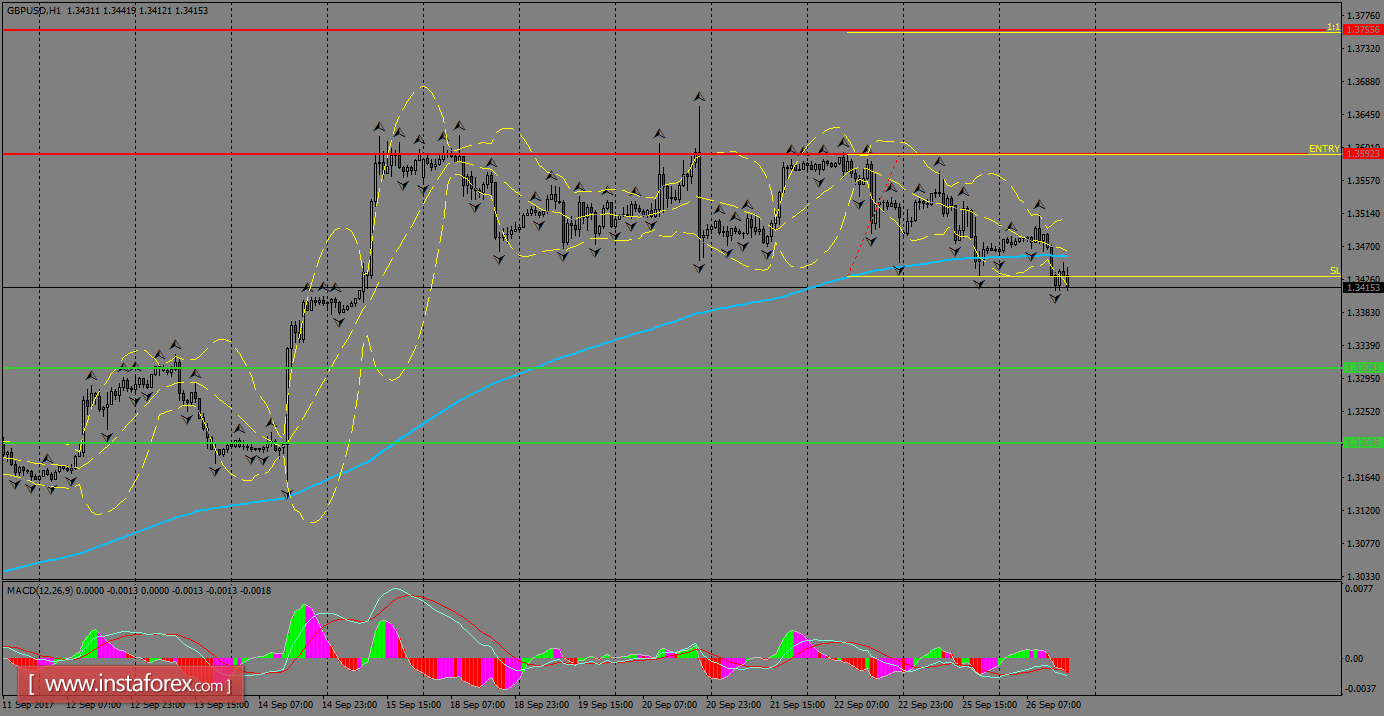
H1 chart's resistance levels: 1.3592 / 1.3755
H1 chart's support levels: 1.3309 / 1.3209
Trading recommendations for today: Based on the H1 chart, buy (long) orders only if the GBP/USD pair breaks a bullish candlestick; the resistance level is at 1.3592, take profit is at 1.3755 and stop loss is at 1.3430.
InstaForex analytical reviews will make you fully aware of market trends! Being an InstaForex client, you are provided with a large number of free services for efficient trading.


