
 Stay
Stay 


Patterns are graphical models which are formed in the chart by the price. According to one of the technical analysis postulates, history (price movement) repeats itself. It means that the price movements are often similar in the same situations which makes it possible to predict the further development of the situation with a high probability.
Discover Forex chart patterns, signals, and trading strategies on InstaForex.
was formed on 02.03 at 12:00:01 (UTC+0)
signal strength 4 of 5
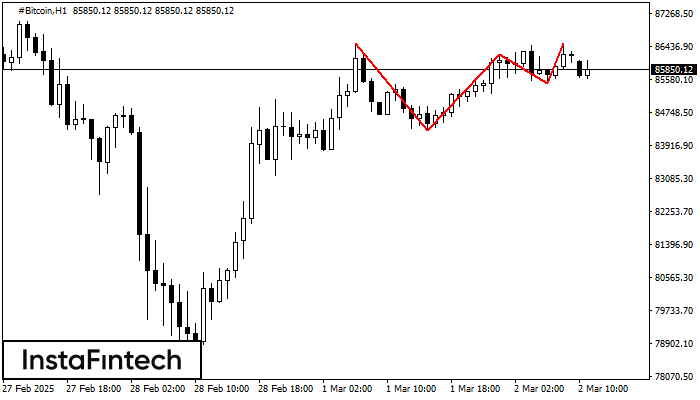
The Triple Top pattern has formed on the chart of the #Bitcoin H1. Features of the pattern: borders have an ascending angle; the lower line of the pattern has the coordinates 84310.46/85489.25 with the upper limit 86516.64/86516.03; the projection of the width is 220618 points. The formation of the Triple Top figure most likely indicates a change in the trend from upward to downward. This means that in the event of a breakdown of the support level of 84310.46, the price is most likely to continue the downward movement.


