 Stay
Stay 
Trading Conditions
Products
Tools


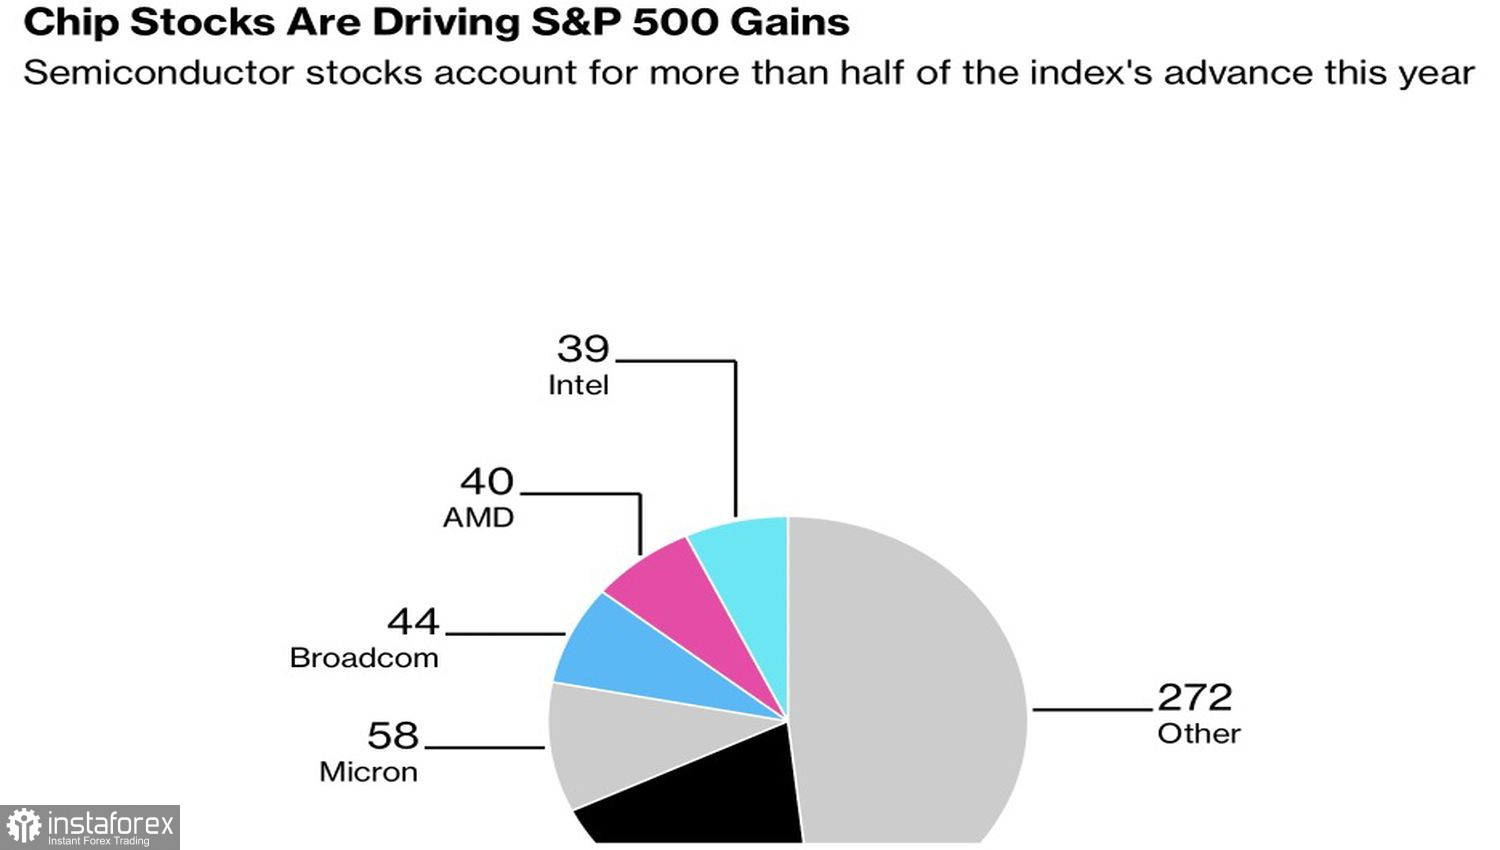
When greed gives way to fear, the S&P 500 typically has no choice but to fall. A broad rise in bond yields on bets of accelerating global inflation produced the index's worst daily performance since March, with the biggest selling concentrated in recent leaders — chipmakers.
Memory-chip producers now account for a record 18% of the S&P 500 and generate roughly half of the index's 2026 earnings. NVIDIA remains the sector's anchor. Standouts this year include Sandisk and Micron Technology, whose shares have risen fivefold and more than twofold, respectively, since the start of the year.
Chipmakers' market structure
That extreme concentration in semiconductor names makes the S&P 500 dependent on a single sector. Every firm has its own cycles — booms and busts — and current supply issues could be resolved in time. What happens to the broad index then? It will fall — it just needs a trigger.
Markets lagged in reacting to US inflation data. Fuel was added to the global bond-yield rally by rising political risk in Britain and growing demand for Japanese assets as yields there climbed to levels not seen since 1999. That dynamic is prompting capital repatriation to Asia and selling in US markets.
S&P 500 and Treasury yields dynamics
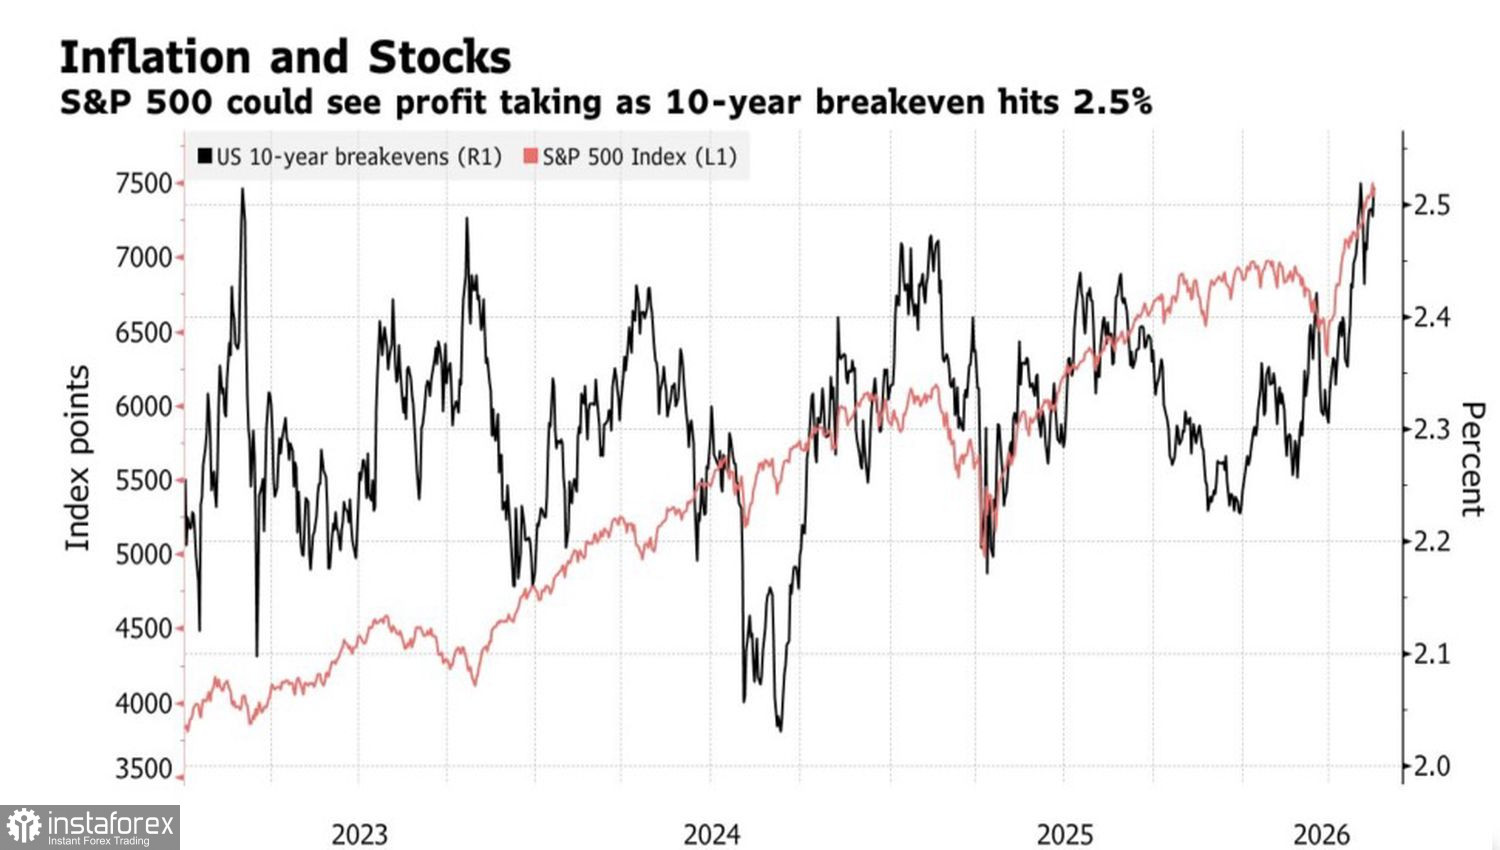
Return of 10-year Treasuries above 4% is a worrying sign. Bank of America research shows that when yields rose similarly in the past, the S&P 500 fell by about 4% over the following three months and by roughly 7% over seven months. The bank now expects rates to exceed 5% by the US midterm elections in November and sees June as a likely month for profit-taking on long equity positions.
Barclays shares a similar view: its internal market-timing indicator is flashing a sell signal for the first time since February 2025.
Bloomberg has also issued warnings: intermarket correlations are so elevated that, unless Treasury yields come down, the broad index faces a correction. My view is that the crowd will first fight to execute the familiar buy-the-dip strategy. If retail investors succeed in propping up the market, a larger pullback may be avoided; only if they fail will a meaningful correction take place.
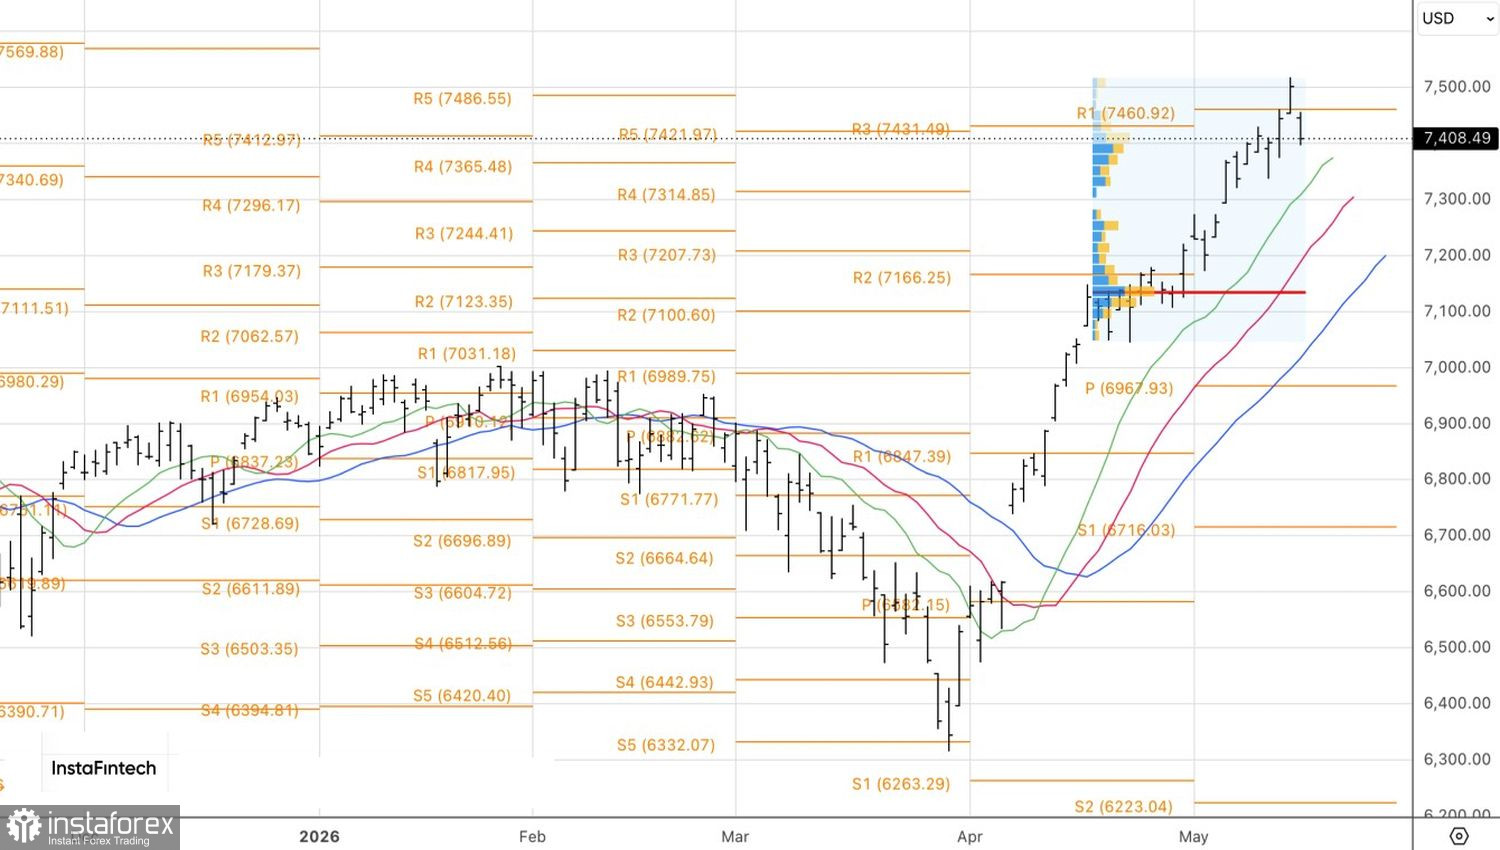
Technically, the daily chart shows that the S&P kicked off the new trading day with a gap that bulls failed to close — a clear sign that buyers are losing steam. I would recommend watching the support levels of 7,365 and 7,315. A rebound from them would allow buyers to re-enter. A break below them, however, would raise the odds of a full-fledged correction. Traders should then reassess strategies and consider short-term selling opportunities.
InstaForex analytical reviews will make you fully aware of market trends! Being an InstaForex client, you are provided with a large number of free services for efficient trading.


