 Stay
Stay 
Trading Conditions
Products
Tools


Our main forecast is based on the expectation of a resumption of growth for XAU/USD. In the current situation of uncertainty, many economists predict an increase in demand for safe-haven assets, particularly gold.
From a technical perspective, XAU/USD is developing a short-term downward dynamics towards key support levels: 1905.00 (144 EMA on the daily chart), 1896.00 (61.8% Fibonacci level in the downward correction wave from its peak at 2070.00 to its low at 1615.00), and 1882.00 (200 EMA on the daily chart).
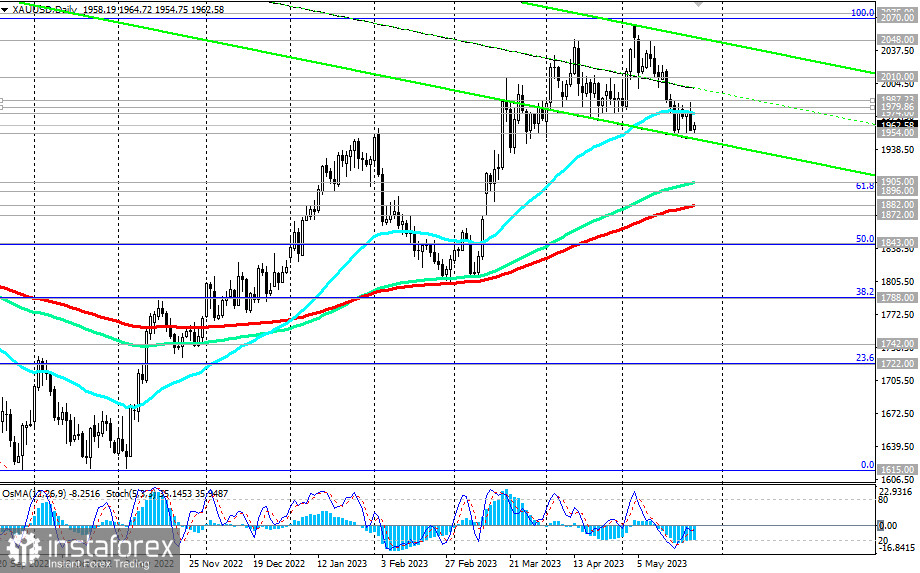
A break below the local support level 1954.00 could activate this downward scenario for XAU/USD. In such a case, a break below the support level of 1872.00 (50 EMA on the weekly chart) and further decline would indicate a break in the medium-term bullish trend.
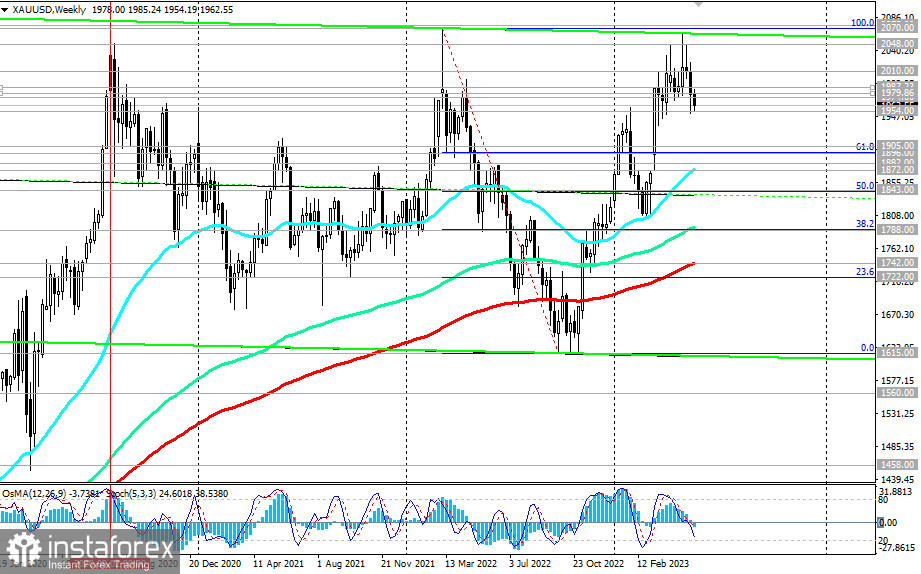
For now, as long as it remains above the key support levels of 1788.00 (144 EMA on the weekly chart and 38.2% Fibonacci level), 1742.00 (200 EMA on the weekly chart), and 1722.00 (23.6% Fibonacci level), XAU/USD remains within the long-term bullish market zone.
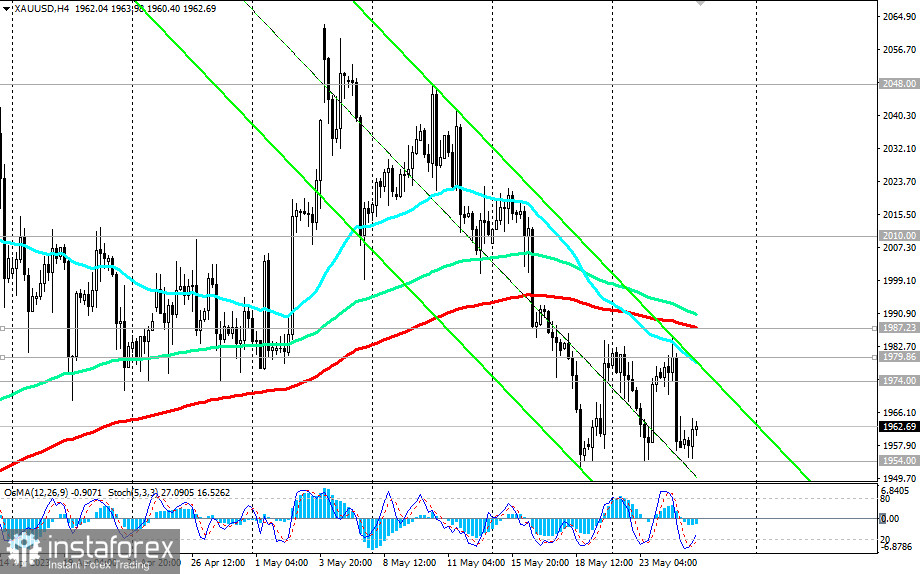
A break above the 1974.00 resistance level could serve as the first signal for a resumption of long positions, with breakouts above the resistance levels of 1980.00 (200 EMA on the 1-hour chart) and 1987.00 (200 EMA on the 4-hour chart) confirming the trend.
Support levels: 1954.00, 1905.00, 1896.00, 1882.00, 1872.00, 1843.00, 1800.00, 1788.00, 1742.00, 1722.00
Resistance levels: 1974.00, 1980.00, 1987.00, 2000.00, 2010.00, 2048.00, 2070.00, 2077.00
InstaForex analytical reviews will make you fully aware of market trends! Being an InstaForex client, you are provided with a large number of free services for efficient trading.


