empty
 
 
You are about to leave
www.instaforex.eu >
a website operated by
INSTANT TRADING EU LTD
Open Account

17.11.201923:58 Forex Analysis & Reviews: EURUSD bounce is underway as expected

Long-term review
This information is provided to retail and professional clients as part of marketing communication. It does not contain and should not be construed as containing investment advice or investment recommendation or an offer or solicitation to engage in any transaction or strategy in financial instruments. Past performance is not a guarantee or prediction of future performance. Instant Trading EU Ltd. makes no representation and assumes no liability as to the accuracy or completeness of the information provided, or any loss arising from any investment based on analysis, forecast or other information provided by an employee of the Company or otherwise. Full disclaimer is available here.

In previous we mentioned the increased probability of a bounce in EURUSD from the major Fibonacci retracement support level around 1.10. Price has bounced from 1.0988 low and the 61.8% Fibonacci retracement level.

Exchange Rates 17.11.2019 analysis

Green lines - bullish divergence

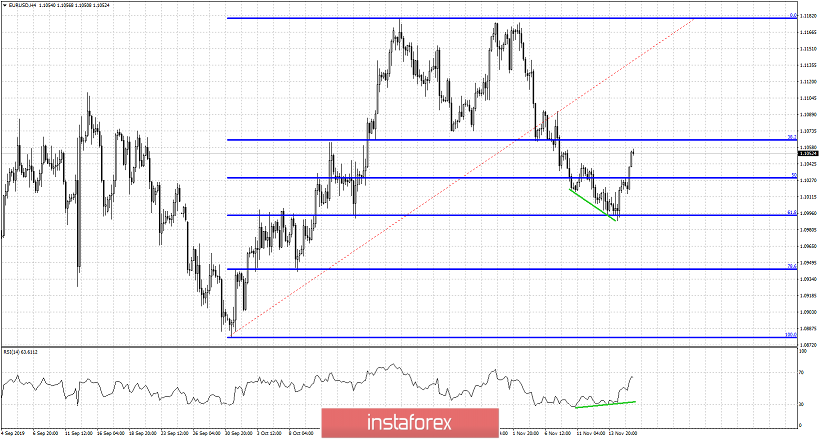
EURUSD ended the week at 1.1052 having bounced off the important Fibonacci support level we mentioned. Additionally we also noted that bullish divergence signs were evident in the 4 hour RSI and that was a warning for bears. This warning was a sign of increased chances of a bounce....The bounce came and it is now very important to see how this week unfolds. Has EURUSD made an equally important higher low relative to the October low of 1.0880. Is this the level where we see the start of a new upward wave that will eventually push price above 1.12?There are many chances of this happening.

Exchange Rates 17.11.2019 analysis

In Ichimoku cloud terms EURUSD is challenging short-term cloud resistance. Support is at 1.1020 and resistance at 1.1050. Trend remains bearish as price is below the 4 hour cloud. In order for the short-term trend to change to bullish price must break above the Kumo (cloud). Additionally bulls want price to continue making higher highs and higher lows as the tenkan-sen (red line indicator) is about to cross above the kijun-sen (green line indicator). This happening below the cloud is a weak bullish signal, but still a bullish one. So bears need to be cautious. A rejection at 1.1050 if followed by a weekly close below 1.0980 would be a bearish sign.
Alexandros Yfantis
Analytical expert of InstaForex
© 2007-2024

Open trading account

InstaForex analytical reviews will make you fully aware of market trends! Being an InstaForex client, you are provided with a large number of free services for efficient trading.


You are now leaving www.instaforex.eu, a website operated by INSTANT TRADING EU LTD
Can't speak right now?
Ask your question in the chat.

Turn "Do Not Track" off