 Stay
Stay 
Trading Conditions
Products
Tools


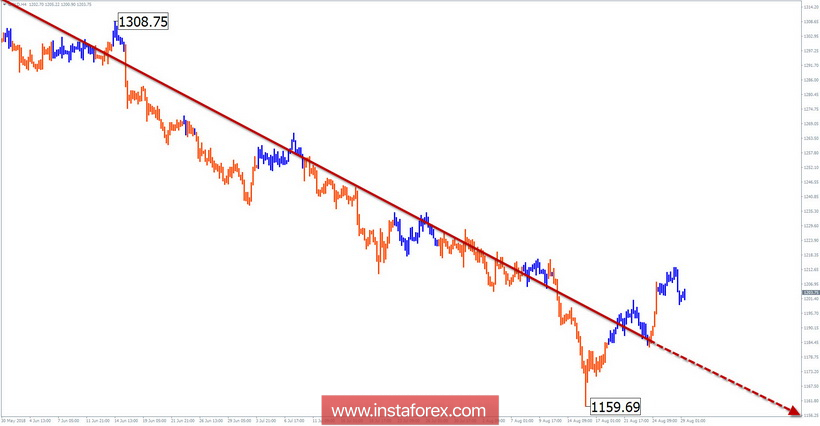
Wave picture of the H4 chart:
The prevailing trend on the gold chart moves the price downwards. The last and incomplete part from April 12 forms a wave of analyzed scale.
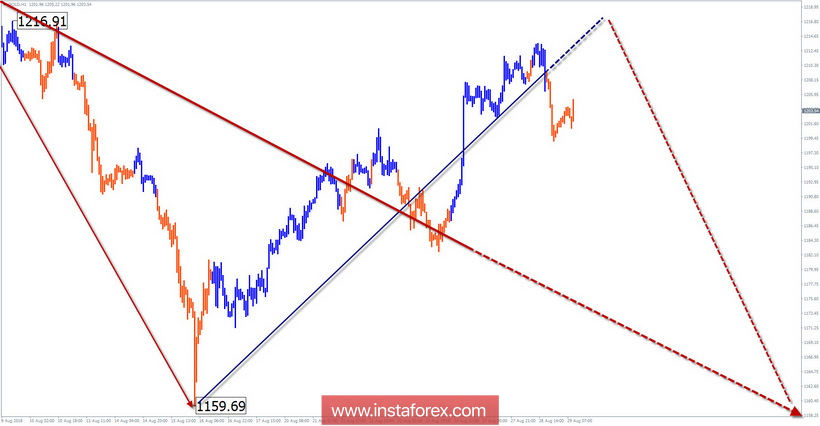
The wave pattern of the H1 graph:
Bear zone from June 14 forms the final part of a larger wave.
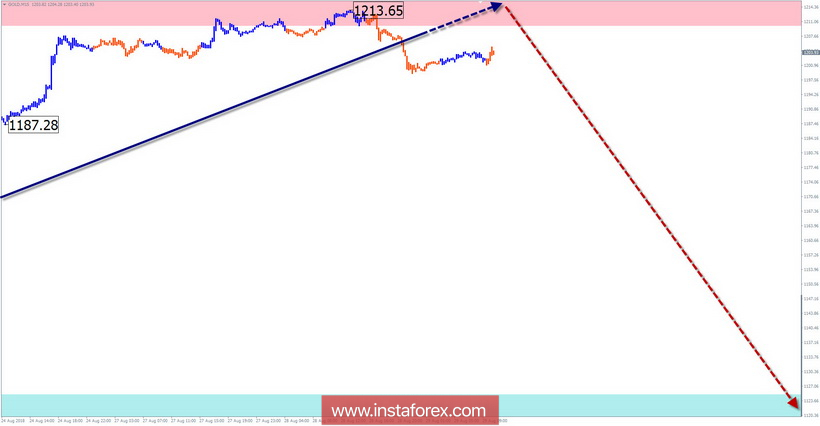
The wave pattern of the M15 chart:
Since August 16, the bullish wave corrects the last trend area of the higher TF. The price has reached the lower limit of the calculated completion zone.
Recommended trading strategy:
In the coming days, the gold exchange rate is expected to change. To open trading transactions, it is recommended to track the sell signals of the instrument.
Resistance zones:
- 1210.0 / 1220.0
Support zones:
- 1125.0 / 1115.0
Explanations to the figures: In a simplified wave analysis, waves consisting of 3 parts (A-B-C) are used. For analysis, 3 main TFs are used, on each one the last and incomplete wave is analyzed. Zones show the calculated areas with the highest probability of a turn.
Arrows indicate the wave counting according to the technique used by the author. The solid background shows the generated structure, the dotted - the expected movements.
Attention: The wave algorithm does not take into account the duration of the tool movements in time. To conduct a trade transaction, you need confirmation signals from your trading systems!
* The presented market analysis is informative and does not constitute a guide to the transaction.
InstaForex analytical reviews will make you fully aware of market trends! Being an InstaForex client, you are provided with a large number of free services for efficient trading.


