 Stay
Stay 
Trading Conditions
Products
Tools


Trend analysis.
This week, the price will move down with the first target of 1.2608 – a retracement level of 38.2% (red dotted line). If achieved, the next target is 1.2483 – a retracement level of 50.0% (red dotted line).
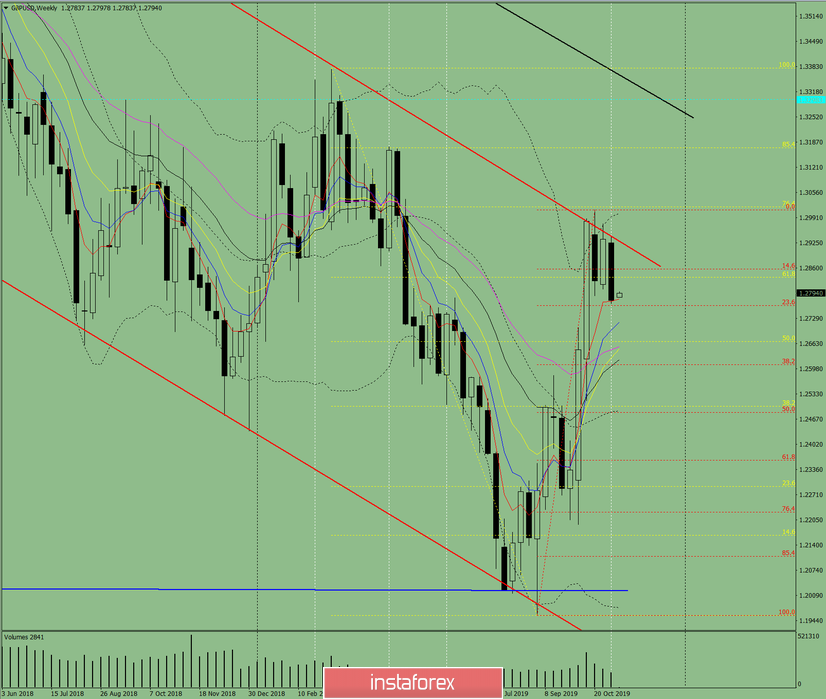
Fig. 1 (weekly chart).
Complex analysis:
- Indicator analysis – up;
- Fibonacci levels – down;
- Volumes – up;
- Candlestick analysis – down;
- Trend analysis – down;
- Bollinger bands – down;
- Monthly chart – down.
The conclusion of the complex analysis – a downward movement.
The overall result of calculating the candle of the GBP/USD currency pair according to the weekly chart: the price for weeks will most likely have a downward trend with the absence of the first upper shadow of the weekly black candlestick (Monday – down) and the absence of the second lower shadow (Friday – down).
The lower target of 1.2608 – a retracement level of 38.2% (red dotted line). If achieved, the next target is 1.2483 – a retracement level of 50.0% (red dotted line).
An unlikely scenario – from the level of 1.2784, work up with the target of 1.2925 – resistance line (red bold line).
InstaForex analytical reviews will make you fully aware of market trends! Being an InstaForex client, you are provided with a large number of free services for efficient trading.


