 Stay
Stay 
Trading Conditions
Products
Tools


Trend analysis (Fig. 1).
On Thursday, after retesting the pullback level of 50% which is equivalent to 1.1146 presented in a blue dashed line, the price may go down and the first lower target is the pullback level of 14.6% equivalent to 1.1122 presented in a red dashed line. If successful, the next lower target 1.1107 is a retracement level of 23.6% presented in a red dashed line. Much will depend on the news that comes out at 12:45 and 13:30 Universal time.
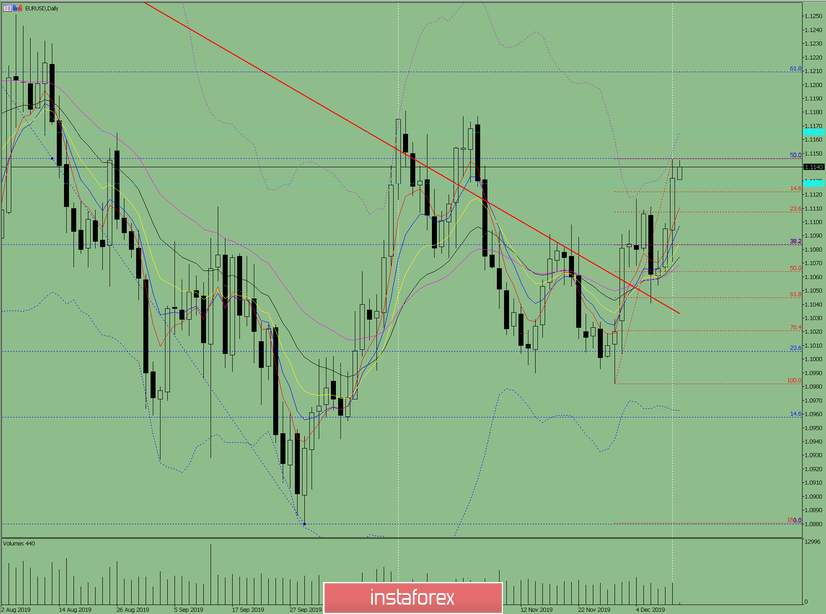
Fig. 1 (daily chart).
Comprehensive analysis:
- Indicator analysis - down;
- Fibonacci levels - down;
- Volumes - up;
- Candlestick analysis - down;
- Trend analysis - up;
- Bollinger Lines - up;
- Weekly schedule - up.
General conclusion:
On Thursday, after retesting the pullback level of 50% which is equivalent to 1.1146 presented in a blue dashed line, the price may go down and the first lower target is the pullback level of 14.6% equivalent to 1.1122 presented in a red dashed line. If successful, the next lower target 1.1107 is a retracement level of 23.6% presented in a red dashed line.
An unlikely scenario would be that the price goes up to the upper target 1.1165 which is the historical resistance level presented in a blue dashed line.
InstaForex analytical reviews will make you fully aware of market trends! Being an InstaForex client, you are provided with a large number of free services for efficient trading.


