 Stay
Stay 
Trading Conditions
Products
Tools


Last week, the pair, having broken through the resistance line 1.2871 (white bold line), made an upward movement and then broke through the pullback level 23.6% - 1.3029 (red dashed line). Thus, the upward movement will most likely continue this week.
Trend analysis:
This week, the price is likely to continue to move upward, with the goal of reaching the resistance line - 1. 3170 (black bold line), and if this line is reached - pullback work down with the target 1.3003 - 13 average EMA (yellow thin line).
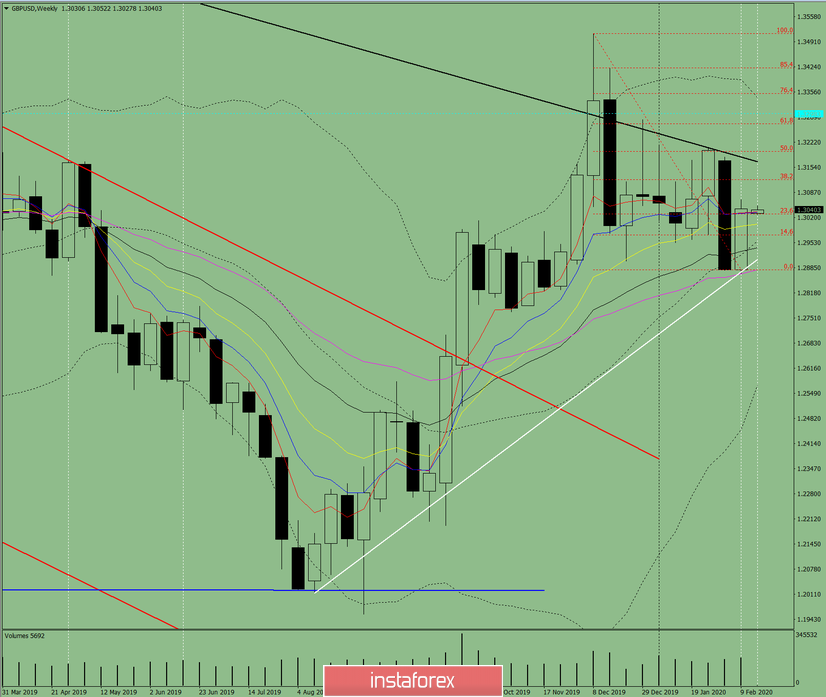
Fig. 1 (weekly schedule).
Comprehensive analysis:
- indicator analysis - up;
- Fibonacci levels - up;
- volumes - up;
- candlestick analysis - neutral;
- trend analysis - up;
- Bollinger Lines - down;
- monthly chart - down.
The conclusion of a comprehensive analysis is an upward movement.
The overall result of calculating the candle of the GBP / USD currency pair according to the weekly chart: the price of the week is likely to have an upward trend with the absence of the first lower shadow of the weekly white candlestick (Monday - up) and the presence of the second upper shadow (Friday - down).
The first upper target of 1. 3170 is the resistance line (black bold line).
An unlikely lower scenario: work down with the first target 1.2904 - support line (white bold line) from a pullback level of 23.6% - 1.3029 (red dashed line).
InstaForex analytical reviews will make you fully aware of market trends! Being an InstaForex client, you are provided with a large number of free services for efficient trading.


