 Stay
Stay 
Trading Conditions
Products
Tools


Trend analysis
The price from the level of 1.2941 (the close of the last weekly candle) is expected to decline to the 21 average EMA - 1.2870 (black thin line) this week. If this line is reached, it can work upwards with the goal at 1.2944 - the resistance line (white thick line). Considering that the resistance line is also reached, further growth of the pair is likely.
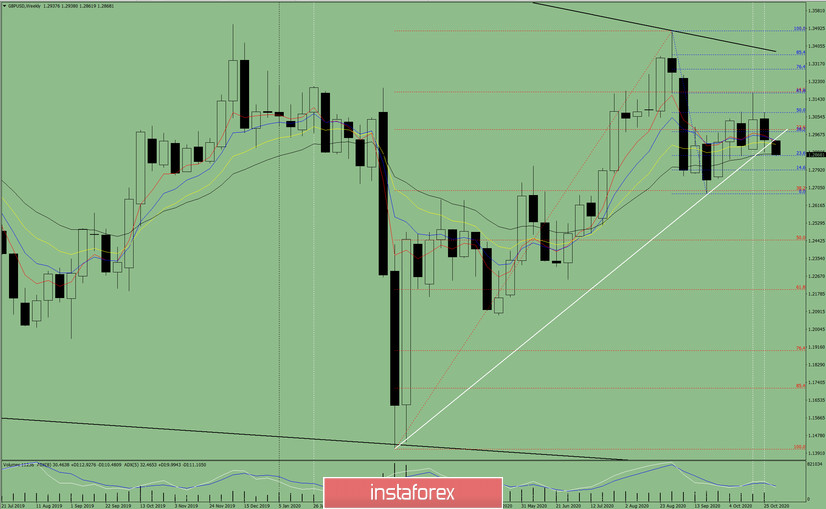
Figure 1: Weekly chart
Comprehensive analysis:
- indicator analysis - up;
- Fibonacci levels - up;
- volumes - up;
- candlestick analysis - up;
- trend analysis - up;
- Bollinger lines - up;
- monthly chart - up.
An increase in the pair can be concluded based on the comprehensive analysis.
The total calculation of candlestick of the GBP/USD pair on a weekly chart: the price is likely to have an upward trend this week, with the first lower shadow at the weekly white candle (Monday - down) and having a second upper shadow (Friday - down).
The first lower target is the 21 average EMA 1.2870 (black thin line). If this line is reached, rising towards the goal at 1.2944 - the resistance line (white thick line) can be expected. After testing the resistance line, we can continue to further increase.
An alternative scenario: the price will decline from the level of 1.2941 (closing of the last weekly candle), in order to reach the 21 average EMA - 1.2870 (black thin line). In case of reaching this line, a decline is likely in order to test the pullback level of 38.2% - 1.3175 (red dotted line).
InstaForex analytical reviews will make you fully aware of market trends! Being an InstaForex client, you are provided with a large number of free services for efficient trading.

