 Stay
Stay 
Trading Conditions
Products
Tools


Trend analysis
The price from the level of 1.1872 (closing of the last weekly candle) may further increase this week, with the first goal at 1.1908 - the 76.4% pullback level (blue dotted line).
After testing this level, the price can continue to trade upwards to the goal of 1.1951 - the pullback level of 85.4% (blue dotted line). Upon reaching this level, further growth is likely.
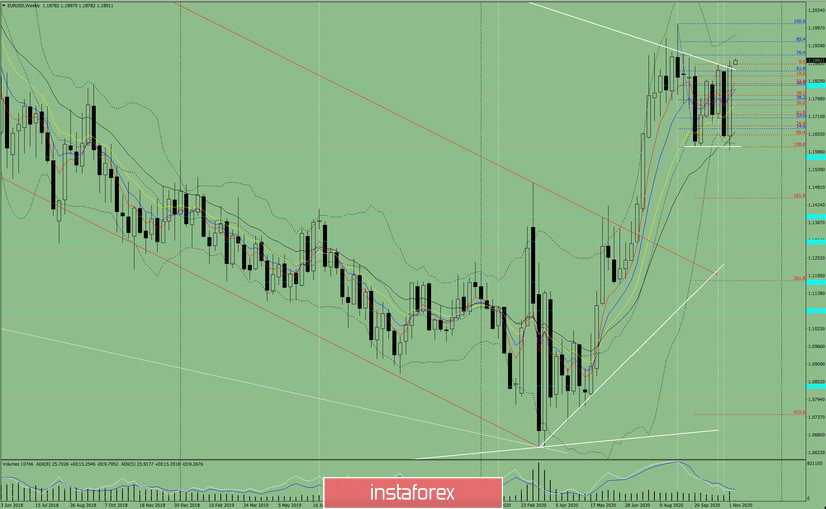
Figure 1 (weekly chart)
Comprehensive analysis:
- indicator analysis - up;
- Fibonacci levels - up;
- volumes - up;
- candlestick analysis - down;
- trend analysis - up;
- Bollinger lines - up;
- monthly chart - up.
A rise can be concluded based on comprehensive analysis.
The total result of the calculation of the candlestick of the EUR/USD pair on the weekly chart: the price is likely to have an upward trend this week, with no lower shadow in the weekly white candlestick (Monday - up) and no upper shadow (Friday - up).
The first upper goal is located at 1.1908 - 76.4% pullback level (blue dotted line). After testing this level, the price can continue to trade upwards to the goal of 1.1951 - the pullback level of 85.4% (blue dotted line). Upon reaching this level, further growth is likely.
An alternative scenario: the price can decline from the level of 1.1872 (closing of the last weekly candle), with the goal at 1.1821 - a pullback level of 23.6% (red dotted line). If this level is tested, we can move further below with the goal of 1.1779 - 38.3% pullback level (red dotted line). Upon reaching this level, rising will be considered.
InstaForex analytical reviews will make you fully aware of market trends! Being an InstaForex client, you are provided with a large number of free services for efficient trading.


