empty
 
 
You are about to leave
www.instaforex.eu >
a website operated by
INSTANT TRADING EU LTD
Open Account

31.12.202010:44 Forex Analysis & Reviews: Indicator analysis. Daily review for the GBP/USD pair on 12/31/20

This information is provided to retail and professional clients as part of marketing communication. It does not contain and should not be construed as containing investment advice or investment recommendation or an offer or solicitation to engage in any transaction or strategy in financial instruments. Past performance is not a guarantee or prediction of future performance. Instant Trading EU Ltd. makes no representation and assumes no liability as to the accuracy or completeness of the information provided, or any loss arising from any investment based on analysis, forecast or other information provided by an employee of the Company or otherwise. Full disclaimer is available here.

Trend analysis (Fig. 1)

Today, the price from the level of 1.3620 (closing of yesterday's daily candle) will try to move upwards to the target of 1.3677 – the pullback level of 76.4% (yellow dotted line). After testing this line, the upward movement may continue to the next target of 1.3943 – the pullback level of 85.4% (yellow dotted line).

Exchange Rates 31.12.2020 analysis

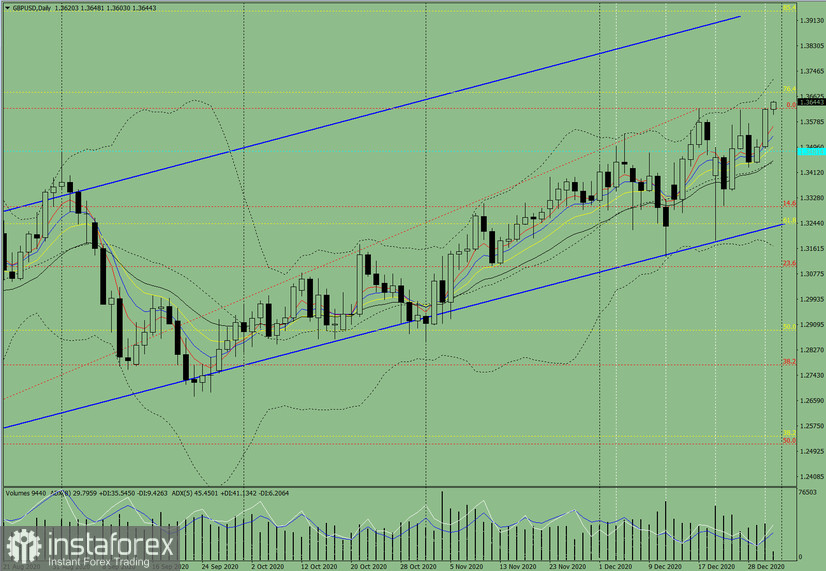
Figure 1 (daily chart).

Comprehensive analysis:

  • Indicator analysis - up
  • Fibonacci levels - up
  • Volumes - up
  • Candlestick analysis - up
  • Trend analysis - up
  • Bollinger lines - up
  • Weekly chart - up

Overall conclusion:

Today, the price from the level of 1.3620 (closing of yesterday's daily candle) will most likely continue rising towards the target of 1.3677 – the pullback level of 76.4% (yellow dotted line). Upon testing this line, the upward movement may continue to the next target of 1.3943 – the pullback level of 85.4% (yellow dotted line).

An alternative scenario: the price from the level of 1.3620 (closing of yesterday's daily candle) may continue to move upwards to the target of 1.3677 – the pullback level of 76.4% (yellow dotted line). After testing this line, a downward pullback is possible, with the target of 1.3481 – the historical support level (blue dashed line).

Stefan Doll
Analytical expert of InstaForex
© 2007-2024

Open trading account

InstaForex analytical reviews will make you fully aware of market trends! Being an InstaForex client, you are provided with a large number of free services for efficient trading.


You are now leaving www.instaforex.eu, a website operated by INSTANT TRADING EU LTD
Can't speak right now?
Ask your question in the chat.

Turn "Do Not Track" off