 Stay
Stay 
Trading Conditions
Products
Tools


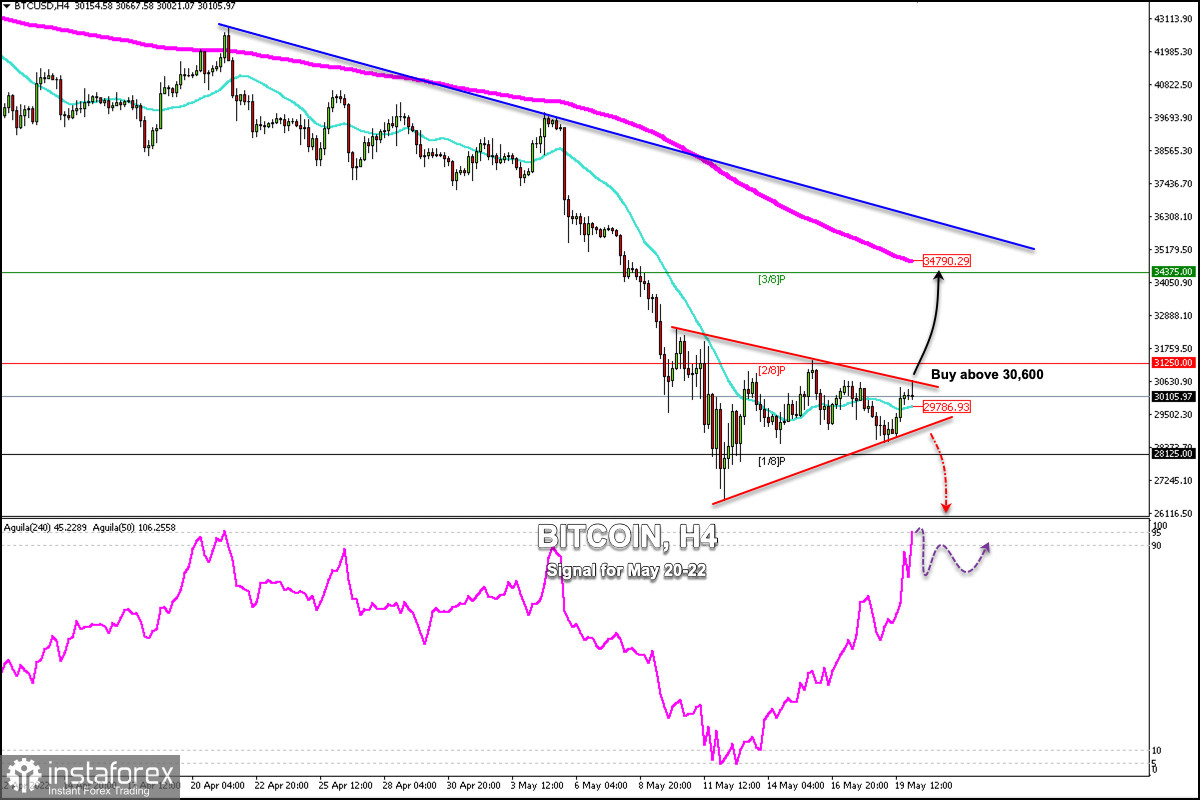
Bitcoin (BTC/USD) is trading above the 21 SMA located at $29,786 and inside the symmetrical triangle formed on May 8. Right now, Bitcoin is trading around the psychological level of $30,000.
A sharp break above this symmetrical triangle around $30,600 could mean the advance of Bitcoin and it could reach 3/8 Murray around $34,375 and even towards the 200 EMA at $34,790.
Conversely, if BTC breaks below the symmetrical triangle and consolidates below $29,000, we could expect further bearish pressure and the price may reach 1/8 Murray at $28,127 and even drop to 0/8 Murray at $25,000.
Since the beginning of the week, the equity market has been under strong selling pressure. As BTC is correlated with the Nasdaq-100, the token kept its upward movement limited.
In the medium term, Bitcoin is trading in a strong downtrend. In the short term, Bitcoin is trading in a range between $31,250 and $28,500. A pullback towards $34,790 or the top of the downtrend channel around $35,200 will be seen as an opportunity to sell with medium-term targets at $25,000.
The eagle indicator on the 4-hour chart has reached the extremely overbought zone. This could be a negative sign for Bitcoin. In case there is a break above $30,600, the bearish pressure is likely to intensify.
Our trading plan for the next few hours is to wait for a sharp break above $30,600 to buy with targets at $32,800 and $34,790.
InstaForex analytical reviews will make you fully aware of market trends! Being an InstaForex client, you are provided with a large number of free services for efficient trading.


