empty
 
 
You are about to leave
www.instaforex.eu >
a website operated by
INSTANT TRADING EU LTD
Open Account

08.11.202218:45 Forex Analysis & Reviews: Update on our NVDA stock price analysis

This information is provided to retail and professional clients as part of marketing communication. It does not contain and should not be construed as containing investment advice or investment recommendation or an offer or solicitation to engage in any transaction or strategy in financial instruments. Past performance is not a guarantee or prediction of future performance. Instant Trading EU Ltd. makes no representation and assumes no liability as to the accuracy or completeness of the information provided, or any loss arising from any investment based on analysis, forecast or other information provided by an employee of the Company or otherwise. Full disclaimer is available here.

Exchange Rates 08.11.2022 analysis

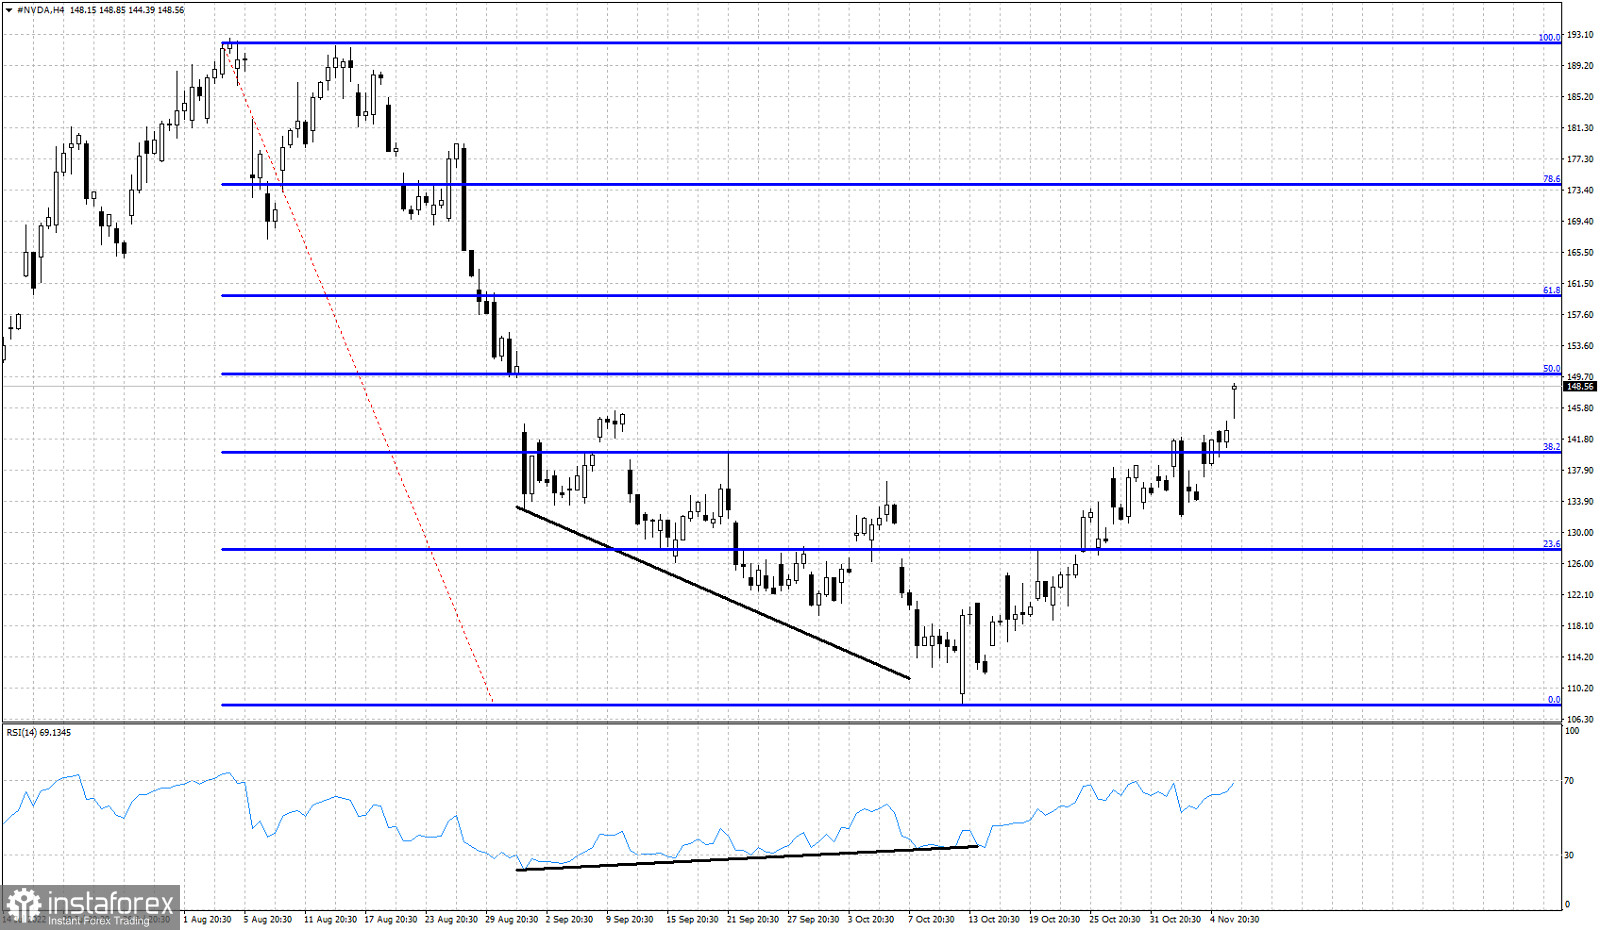
Blue lines- Fibonacci retracements

Black lines- RSI bullish divergence

On October 10th we posted our analysis on NVDA stock when price was trading around $120. We then noted that although trend remained bearish, there were increased chances of a bounce higher. The following days after we posted our analysis, NVDA stock price made a new lower low around $108.15 and started an upward bounce. So far price has retraced nearly 50% of the decline from $192.68. Price has started making higher highs and higher lows. The momentum in the near term is bullish. Next resistance level is at $150 and next at $159.90. Support is found at $131.80.

Alexandros Yfantis
Analytical expert of InstaForex
© 2007-2024

Open trading account

InstaForex analytical reviews will make you fully aware of market trends! Being an InstaForex client, you are provided with a large number of free services for efficient trading.


You are now leaving www.instaforex.eu, a website operated by INSTANT TRADING EU LTD
Can't speak right now?
Ask your question in the chat.

Turn "Do Not Track" off