 Stay
Stay 
Trading Conditions
Products
Tools


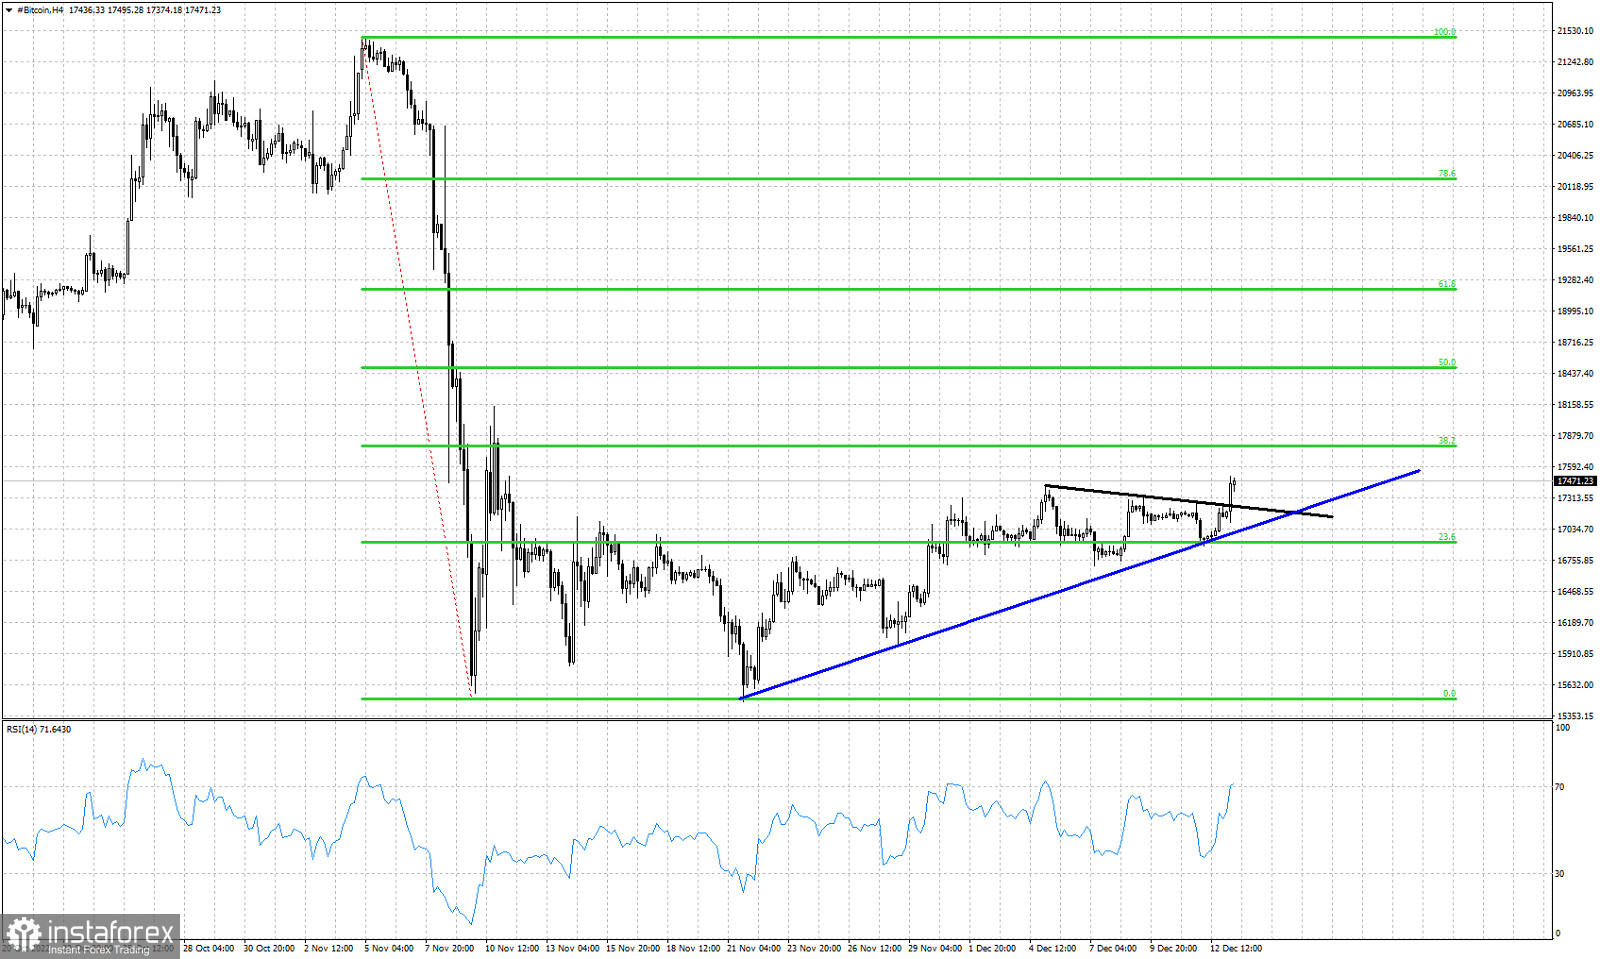
Blue line- support trend line
Black line- resistance trend line (broken)
Green lines- Fibonacci retracements
Bitcoin has broken the short-term resistance trend line at $17,200. Price has provided a new bullish signal and we are now expecting to see a test of the 38% Fibonacci retracement at $17,800. Bitcoin hasn't seen this price level since November 10th. The 38% Fibonacci retracement is the first important Fibonacci resistance. A break above this level would be a bullish sign that could lead to a bigger bounce towards the 61.8% retracement at $19,200. Support is found at $17,00 and as long as price is above this level, bulls will remain in control of the short-term trend. Bulls do not want to see a long upper tail candlestick pattern. They need to keep price above $17,200 and if the $17,800 level is reached, they will need to stay above it. The RSI is making new short-term higher highs, implying that the bullish momentum is strong.
InstaForex analytical reviews will make you fully aware of market trends! Being an InstaForex client, you are provided with a large number of free services for efficient trading.

