 Stay
Stay 
Trading Conditions
Products
Tools


Just as bullish sentiment affects stock markets, approximately the same optimism is present with respect to the most important factor of the bearish rally - inflation. Technical analysis also indicates this. Is it possible that the peak of inflation has already passed and you can exhale? Let's figure it out.
If you follow the dynamics of prices, you could not help but notice that the inflation curve is changing, at least as far as financial markets are concerned. Break-even levels in the bond market show a sharp drop in forecasts over the past few weeks, in reviews for five and ten years. In other words, the break-even level that determines inflation expectations shows us that experts' inflation expectations have weakened, at least for the moment.
Indeed, the five-year forecast, which the Federal Reserve is also guided by, has returned to the level it reached in February 2021 - before the inflation panic intensified.
If you look at the bond charts, you will see a typical "head and shoulders" figure, which may lead you to think that the yield of ten-year stocks is going to fall.
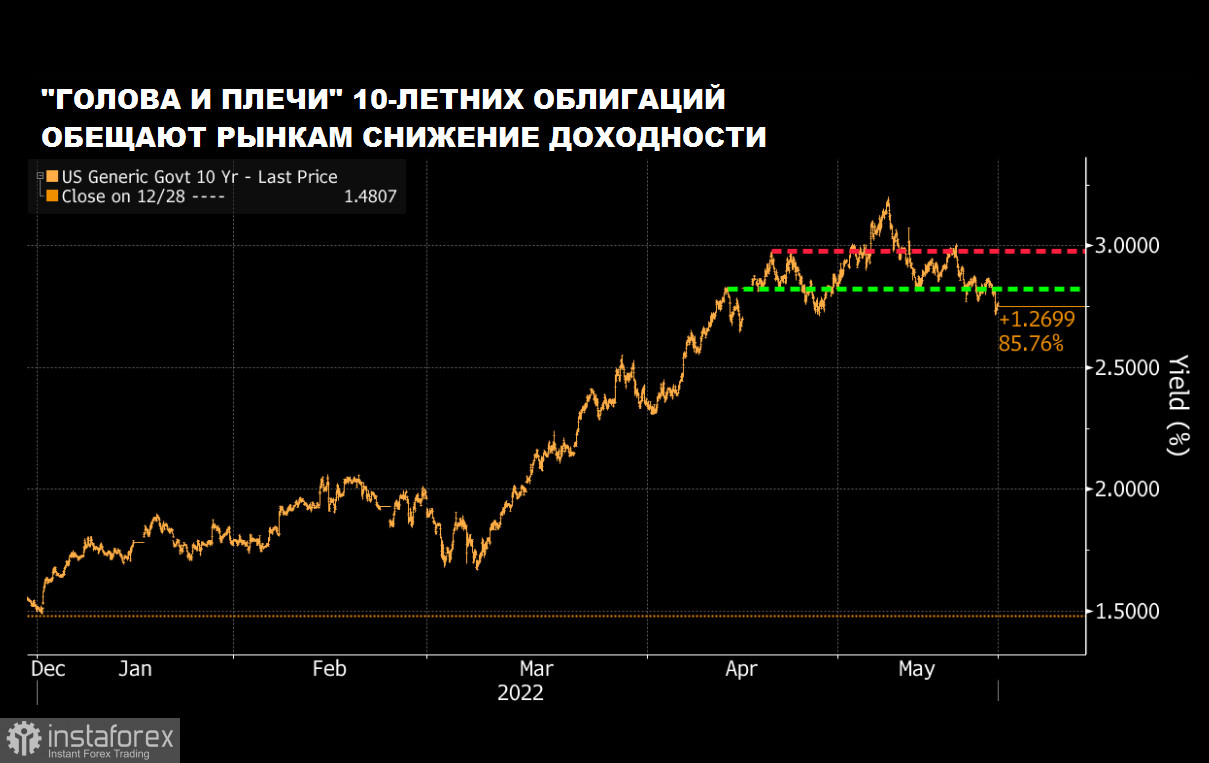
This is usually a signal that markets tend to view inflation as a passing risk, which the Fed is quite capable of coping with.
Even if we take the opinion of skeptics who are sure that technical analysis in trading has the character of self-fulfilling prophecies, this only gives us extra confidence that this "prophecy" has every chance to be realized in the future.
Even though the shoulders are now at the level of 3% yield, nevertheless, the figure indicates that the markets expect prices to fall in a ten-year cut. In fact, technical algorithms will push you to buy this tool if you use technical analysis in your trading activities.
And if you turn to the analysis of the US dollar, you will also get an extra confirmation of your thoughts, since the dollar, largely driven by expectations of rate hikes under the hawkish Fed, also looks to have reached its peak.
You can strengthen your analytics with indicators of its real rate adjusted for inflation - against baskets of currencies, that is, ready-made indices - from JPMorgan or Bloomberg - and make sure that the dollar is stronger than ever before in the last 20 years, having reached the level at the peak of the pandemic two years ago.
Apparently, investors' concern has shifted from inflation to economic growth - and this is noticeable even on the news feed. Inflation became yesterday's news, its risk is taken into account.
There is logic in the fact that we are now more concerned about the recession than inflation. Because only a strong economy can weaken the dollar and relieve price pressure.
In the markets, this is reflected in the relative returns of stocks and bonds. When the risk is "turned off", the fear of a recession grows and traders tend to buy bonds and discount stocks. Conversely, when there is risk, traders sell bonds and buy stocks.
Obviously, as soon as the initial shock of the Russian troops entering Ukraine passed (mid-March), stocks began to rise against bonds, showing the interest of traders.
This interest in itself can be explained by the reporting season, in which traders like to catch big fish.
But over the past month, this process has undergone changes - following the end of the reporting season and the transition to an armed confrontation between the two states without a clear preponderance of the parties. Now this has all turned into high volatility between risk and risk aversion, as views on whether the US is approaching a recession in the near future are changing rapidly.
Combining both parts of the equation, you will come to the conclusion that economic growth has already been stifled by the system, and inflation has already ended. Could it be? Of course not. These are two mutually exclusive factors. So what is really waiting for the markets?
Let's turn to history.
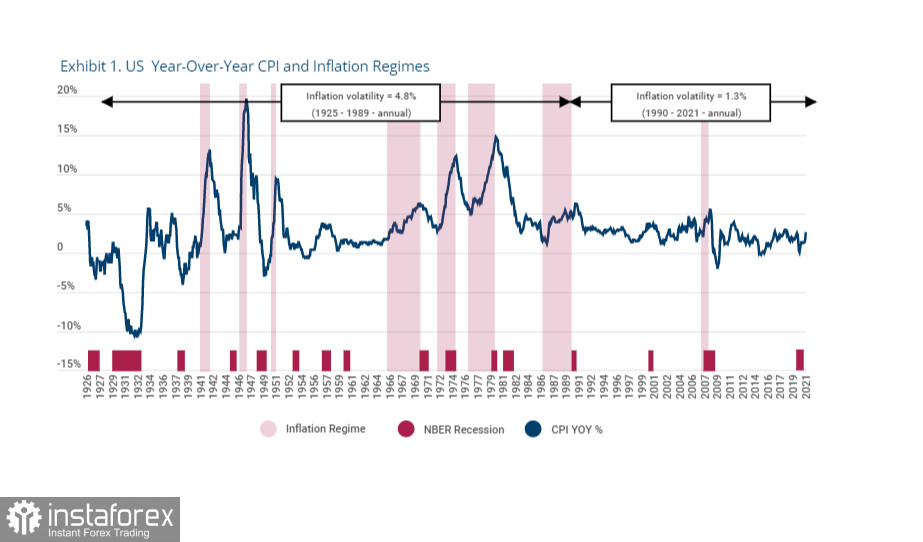
In the graph above, you can see six inflationary eras since the 1920s (highlighted in pink). This is the time when prices were rising. The graph also shows the periods of the recessionary economy and, in fact, the stock market chart itself.
If you look closely at this graph, you'll notice a few obvious things.
First, inflation rarely coincides with periods of recession (which is called stagflation), with the exception of the 70s of the last century, when stagflation swept the American economy.
Inflationary periods last a little longer than recessions (this is explained by the slower recovery of the economy after recessions).
And most importantly, inflation usually ends in recessions. In other words, not all recessions are preceded by price increases, but every price increase inevitably leads to a recession.
This is also understandable. Usually, when inflation is released from the bottle, there comes a period of sharply changing prices with several separate peaks, which reflects the dynamics of prices and producers' reaction to them (budget cuts, for example) and retailers (switching to cheaper analogues, for example).
This was the case during World War II, as well as during the era of the "Great American Inflation" of the 1970s.
This graph shows us that even if inflation has just peaked, the price history has not ended there, opening another period of recession. It is logical that we can expect subsequent waves and increased volatility before this period ends.
If you analyze the dynamics of purchases in developed countries, which, as a rule, have more serious problems with price increases and where overall inflation has reached double digits, it becomes clear again that inflation tends to move in waves.
Since inflation does not reflect prices as such, but their growth over time, it cannot reach a plateau - it must either decline or grow.
In fact, this means that if we observe further signs of a slowdown in the economy (we have observed them since December, but never during this period - categorically negative), then for some time we will observe how inflation slows down.
However, then secondary effects come into play: feedback comes from developing countries that react to the Fed's policy with their own measures, returning the effects of its influence to the US economy with a delay, and inflation gives another surge. Even if inflation continues to decline over the next few months, which is likely, it would be wise to prepare for further spikes before this inflationary era ends.
You and I are well aware that prolonged high inflation has a devastating effect on stock markets, and a little less on currency markets. Moreover, with inflation, all markets become cheaper at once - stocks, bonds, and currencies, albeit relative to each other. And in the absence of inflation, they become more expensive together, even if showing financial flows in separate periods from one segment to another.
Inflation is a time when money itself is getting cheaper (and after it any commodity and material values, including stocks, bonds and anything else).
If you look at the historical price level from this perspective, long-term assets are now more expensive than at any time in more than two centuries. In turn, the last period of the Great Inflation ended in 1981, when they became as cheap as ever. So the assumption that the bear market is waving its furry paw at the bulls for the next few years is not so improbable.
And then follows the standard analysis: what instruments are more profitable to trade during periods of inflation?
Traditionally, during periods of high inflation, durable consumer stocks (average annual yield -15%), 30-year bonds (-8%) and investment-grade corporate bonds (-7%) perform poorly.
To thrive during this period, it is best to bet on horses that provide the basic infrastructure. Energy goods - gas, oil - bring almost all of their profits in inflationary regimes - the real yield is 41% compared to -1% the rest of the time. The commodity section, led by gold and precious metals, generally brings higher real returns in terms of inflation. In other words, commodity markets rule. Obviously, this is what we are seeing today. But will we repeat the experience of the seventies?
Let's look at the real yield of securities. You are well aware of the negative yield of Treasury bonds, but stocks... For example, the return on shares of energy companies adjusted for inflation was as much as... 0%. That is, they paid off - and that's good.
As for commodities, almost everything was protected from inflation, but some instruments (energy carriers and precious metals) coped much better than others.
The rally in commodities will limit the profits that can be made from here for now, especially on short trades. But it is impossible to ignore the exceptional profitability of this sector if you bet that inflation will continue to rise.
Meanwhile, there is another, much more promising way to thrive in an inflationary environment, this is following the trend.
There is a research from Draiisma confirming that those who closely monitor trends, for example, in the stock market (devoted followers of momentum), earn almost as well in terms of inflation (up to 8%) as in the rest of the time (up to 11%).
It turns out that momentum strategies applied to all asset classes work much better (on average 25% in inflationary regimes versus 16% the rest of the time).
Therefore, if you are looking for new strategies that will work better during this period, it is time for macroeconomics or trend–following strategies that should start making a profit right now - against that calm and satisfying time when they were not so effective.
Factor investing may also play a role in the stock market, although it helps to make "short" bets on the fall of some stocks, as well as open long positions. Large companies and "high-quality" stocks with stable profits and a strong balance sheet, as expected, are strong in the era of inflation, and this is logical.
But whether you play for the market favorites or against their more unsuccessful colleagues, you should always keep in mind the history of Walmart, and the fact that the funds of companies are now somewhat inflated - even very liquid companies: in real terms, the premium for opening shorts for small and large companies is -4% per year during inflationary periods - compared to +1% in normal time.
This is easy to comprehend intuitively, because stock markets are the first to take off at the moments of market contraction. The Fed itself knows this very well and even uses it.
Finally, there is always a refuge in collectibles for those who can afford it. This is a question of why the economy of Switzerland, which produces collectible watches, can perform better during a period of inflation than, for example, the economy of Germany, which produces cars.
As a result, the currencies of such countries can protect you from excessive volatility, while at the same time predictably following the trend. And collecting itself (for example, NFT) can help to "save and invest". The real yield was positive for all classes of collectible assets in the conditions of inflation: the yield of works of art was +7%, wine - +5%, and stamps - +9%. It makes sense to extrapolate this to the NFT market, which is ready to offer low prices due to underdevelopment in difficult times.
InstaForex analytical reviews will make you fully aware of market trends! Being an InstaForex client, you are provided with a large number of free services for efficient trading.


